


نمونه رایتینگ Average Time Spent School Children on TV Computer
نمونه رایتینگ Average Time Spent School Children on TV Computer
در این صفحه یک نمونه رایتینگ برای یک نمودار خطی ساده توسط مدرس آیلتس با نمره 8 نوشته شده است. این پاسخ با وجود ساده بودن کامل بوده و تمامی ویژگی های لازم برای دریافت نمره 7 را داراست. با اینهمه، این سوال جنبه تمرینی داشته و نمونه سوالات روز آزمون آیلتس چالش بسیار بیشتری خواهد داشت.
.
نمونه رایتینگ Average Time Spent School Children on TV Computer
نمونه رایتینگ Average Time Spent School Children on TV Computer
نمونه پاسخ مدرس بدون خطای دستوری و واژگان مناسب
The graph shows the average weekly time spent by children at the age of 10 to 11 on two different leisure activities (TV and computer) at home. (27)
Schoolchildren spent just under 4 hours a week on computer at the beginning of the period in 2000. This number increased steadily for the next 4 years to 15 hours in 2004. Then it increased more slowly during the following 4 years to 2008 to reach a peak of almost 22 hours per week. (54)
Time spent on TV was much higher compare to computer at the beginning of the period. It started at 21 hours in 2000 and stayed the same until 2003. At this time it showed a downward trend and fell to 15 hours in 2004. During the next 4 years up to the end of period in 2008, despite some fluctuations, it remained stable at this level. (66)
Overall, it seems children’s preference for these two pastime activities changed dramatically and during this nine-year period they have reversed. (20)
(167 Words)
.
نمونه پاسخ خوب یکی از زبان آموزان دوره آیلتس اردیبهشت 1400
The line graph illustrates the average weekly time spent on two different leisure activities (TV and Computer), from 2000 until 2008 by children at the age of 10 to 11.
Using the computer was not a favorite hobby among children at first. They spent just 3 hours per week on computers in 2000. This time grew slowly to approximately 15 hours during the next 4 years and then with a sharp upward climb reached a peak of almost 22 hours a week at the end of this period.
School children preferred TV to computers in 2000. They devoted 21 hours to watching TV at the beginning of the period and it stayed the same until 2003. After that, it sharply fell to 15 hours per week through 1 year in 2004. Although there were some fluctuations during the next 4 years, it remained stable at this level until the end of the period in 2008.
Overall, at first, TV was an interesting hobby for school children and they spent most of their free time on TV compared to computers. But these two pastime activities dramatically reversed during this nine-year period.
.
نمونه پاسخ خوب یکی از زبان آموزان دوره آیلتس بهمن 1399
The given line graph illustrates the average weekly time spent by schoolchildren on two different pastime activities (TV and computer) over a period of 9 years. (26)
The time spent on computers started at approximately 3 hours per week in 2000. After that, it showed a significant upward trend to reach about 15 hours a week. Then it increased again but more slowly than in the past. In 2008 it rose to a peak of 21 hours a week that was the biggest number over the period shown. (60)
Schoolchildren devoted 21 hours a week to TV at the beginning of this period in 2000. This figure had a period of stability from 2000 to 2003 and after that, it hit the lowest point of 15 hours a week in 2004. Even though there are some minor variations between 2004 and 2008, it remained constant throughout this period. (59)
Overall, at first, TV was more favored compared to the computer. Despite the fact that TV remained popular among them, their favorite leisure activity reversed in the latest years. (28)
Total words:178
.
#feedback
✅گزینش اطلاعات اصلی و گزارش این اطلاعات به خوبی انجام شده.
✅ساختارهای دستوری و واژگان وضعیت مطلوبی دارند.
✅پیوستگی جمله ها و قابلیت دنبال کردن آن ها مناسب هست.
.
نمونه پاسخ خوب یکی از زبان آموزان دوره آیلتس فروردین 1399
The graph shows the average weekly time spent on various activities done at home by schoolchildren between the ages of 10 and 11 from 2000 to 2008.
Using the computer, was not favored at the beginning of this period in 2000 with roughly 4 hours per week, (hrs/wk), however, it slightly rose until 2001, and then it witnessed a significant increase by approximately 10 hrs/wk until 2004. It reached its highest point during the period in 2008 with 22 hrs/wk.
As the figures depict, the children strongly preferred TV to computer in 2000 since they watched TV 21 hrs/wk and that remained constant for three years after that, but it sharply fell through 1 year by 6 hrs/wk, and reached 14 hrs/wk in 2004. Despite some minor fluctuations, the time the schoolchildren spent watching television remained stable by 14 hrs/wk, until the end of the period in 2008.
Overall, while in the initial years of the period, watching TV occupied most of these children’s leisure time, they increasingly devoted more and more time to computers in these nine years. However, the popularity of TV did not markedly decline.
(188 Words)
.
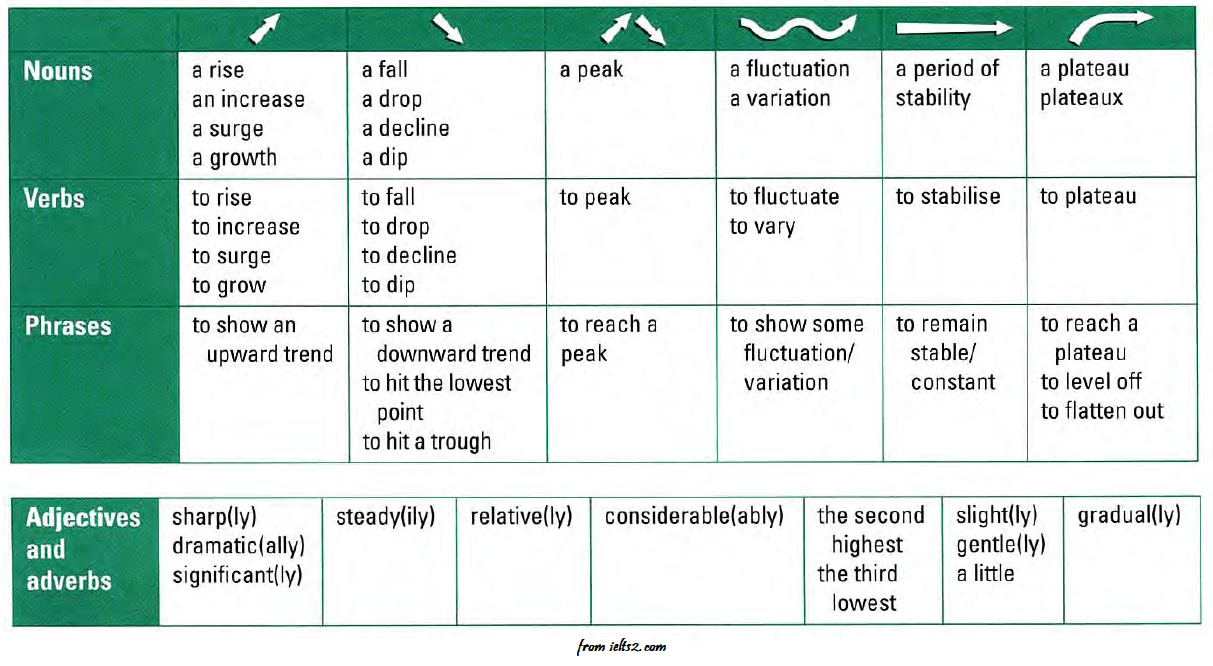
ساختارهای ضروری برای تسک اول رایتینگ آیلتس آکادمیک
دیدن جدول و ساختارهای کاربردی بیشتر
.
نمونه توضیح ساده برای تغییرات مربوط به Computer
The time spent on TV was by far the biggest number but showed a decline over the years. It started at 21 hours per week in 2000. This figure remained stable for the next three years and then fell to 15 hours per week in 2004. Between 2004 and 2008, the present time, it remained unchanged at this level despite some fluctuations.
نمونه توضیح پیشرفته تر برای همین تغییرات
Starting at just over 20 hours a week, TV had the greatest figure in 2000 showing a period of stability for a couple of years, before dropping to 15 hours a week in 2004, where it is surpassed by time spent on computer. By 2008, it had remained relatively stable at the same level despite some fluctuations in about 2006.
.
it witnessed….
…. stood at only….
.
تمرین – عبارت های مناسب را برای هر نقطه از نمودار انتخاب نمایید.
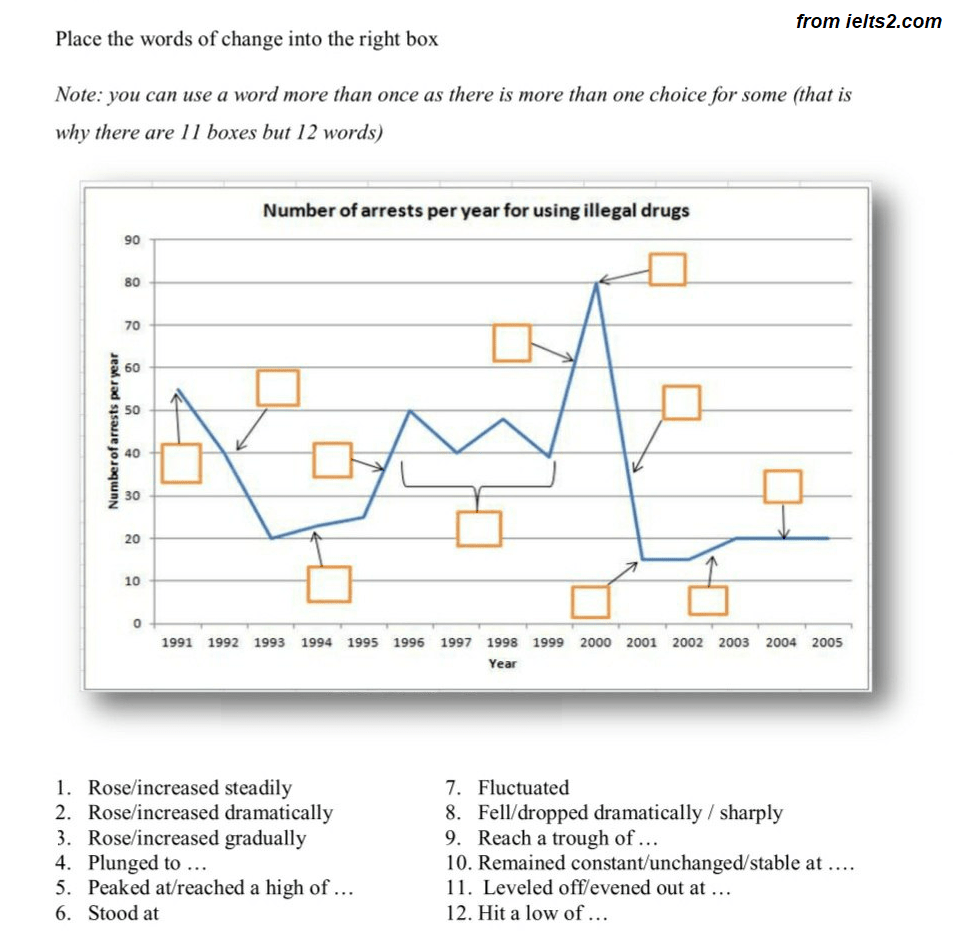
.
.
تمرین – جاهای خالی را با واژگان مناسب پر کنید.

.
.
نمونه رایتینگ Average Time Spent School Children TV Computer – بیشتر بخوانید
جدیدترین منابع Self Study آیلتس (2019) + برنامه ریزی!

.
گلچین واژگان رایتینگ 7+ آیلتس

.
دانلود 100 تک آهنگ خاص انگلیسی با متن

.
دانلود 55 شاهکار سینمایی زبان اصلی با زیرنویس

.
1000 ویدئوی آموزش زبان انگلیسی

.
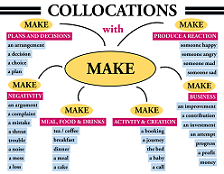
کالوکیشن های ضروری 7 رایتینگ آیلتس
.
سوالات اسپیکینگ آیلتس 2019 + جواب نمره 8
.
دانلود 1200 لغت متداول در لیسنینگ آیلتس

.
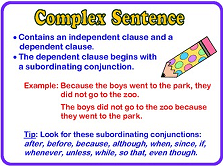
جمله ساده/مرکب/پیچیده در رایتینگ آیلتس
.
کلمات ربط در رایتینگ و آیلتس

.
دانلود 100 داستان کوتاه ماندگار به زبان انگلیسی
.
100 اپلیکیشن برتر سال 2018(معرفی و دانلود)

دانلود بهترین های موسیقی کلاسیک جهان

.
دانلود 55 انیمیشن برتر تاریخ سینما با زیرنویس انگلیسی
.
معرفی و دانلود 100 کتاب تاثیرگذار تاریخ
.
دانلود گلچین 55 مستند برای تقویت زبان انگلیسی


.
.
دانلود اپلیکیشن های اندرویدی آیلتس، تافل و زبان انگلیسی
.
دانلود ویدیوی سخنرانی های TED برای تقویت لیسنینگ آیلتس
.
دانلود گلچین کتاب های آموزش گرامر انگلیسی

.
آموزش ویدیویی و متنی گرامر زبان انگلیسی
.
بایگانی کامل مجموعه 6 Minute English سال 2008 تا 2018
.
دانلود 400 برنامه British Council Podcasts بهمراه Text
.
تاثیر گذارترین سخنرانی های تاریخ جهان (دربرگیرنده 118 سخنرانی)