


رایتینگ تسک 1 آکادمیک پای چارت 4 تایی
رایتینگ تسک 1 آکادمیک پای چارت 4 تایی
نمونه سوال رایتینگ تسک 1 بالا از تست چهارم کتاب کمبریج آیلتس 7 بوده و 2 نمونه پاسخ برای این سوال در دسترس زبان آموزان گرامی قرار میگیرد. یکی در سطح نمره 9 که در آخر این کتاب به عنوان نمونه با نمره کامل درج شده و دیگری نمونه ای در سطح نمره 7 تا 7.5 تنظیم شده توسط مهندس ابوالقاسمی دریافت کننده نمره 8 رایتینگ آیلتس آکادمیک. این رایتینگ از نمودارهای دایره ای یا کلبوچه ای (pie chart) می باشد و امیدواریم این 2 سمپل به همراه ده ها نمونه و سمپل از مراجع معتبر دیگر منتشر شده در سایت ielts2 راهنمای خوبی برای زبان آموزان گرامی باشد.
تعیین سطح رایگان رایتینگ شما در گروه تلگرام @ielts2group
.
.
نمونه نوشته شده توسط مدرس در سطح نمره 7 تا 7.5
.
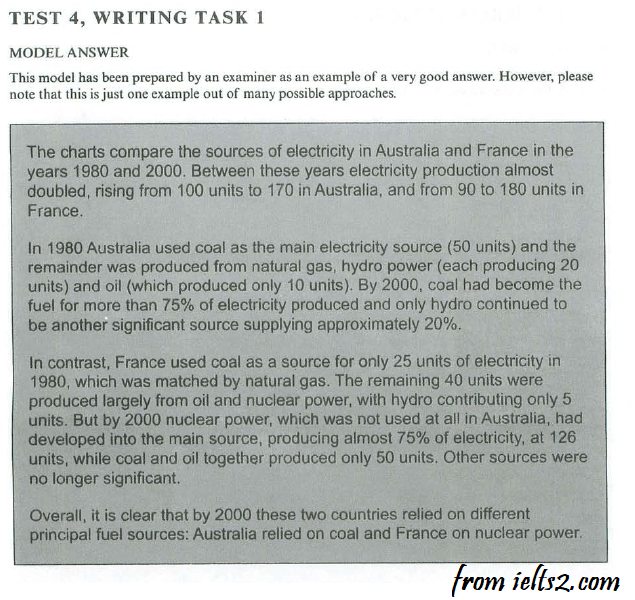
The amount of electricity production and the contributing fuels in Australia and France are shown in a set of pie charts in 1980 and 2000. Different fuels disproportionately produced electricity in these two countries.
Overall, electricity generation in both countries saw a dramatic surge of almost 100% but different fuels played the most crucial role in each country.
In 1980, coal contributed the half of the whole 100 units of electricity production in Australia, followed by hydropower and natural gas, each of which produced 20 percent. Only 10 percent of electricity was produced by oil. By 2000, coal had become a dominant contributor, producing about two third of the whole production. Hydropower’s share of production rose to 36 units but the contribution of other fuels remained negligible.
In France, however, about two third of the whole electricity production of 90 units belonged to coal, natural gas and oil, with 25, 25 and 20 percent respectively. Nuclear power produced a small share of only 15 percent followed by only 5 percent of hydro power. In 2000, the whole production doubled (180 Units), which heavily relied on nuclear energy (126 units). Coal and oil’s electricity production remained unchanged and other fuels’ production were negligible.
Total = 202 Words
.
.
نمونه رایتینگ نقشه آیلتس Task 1 نمره 9
.
.
نمونه نوشته شده توسط مهدی الف، از زبان آموزان دوره دی ماه 1401
Assignments of the 45th session
Writing task 1 (electricity production by fuel source)
These pie charts illustrate amounts of electricity in Australia and France in 1980 and 2000 which are produced by 5 kinds of fuel sources.
In 1980, in Australia, half of the quantity of electricity was produced by coal. Each of the natural gas and hydro power had a cut of 20 percent from total production (100 units) and just 10 units of electricity were contributed by oil. By 2000, not only total production of electricity had increased to 170, but also electricity produced by coal dramatically grew to 130 units. The remainder was produced by hydro power (36 units), natural gas and oil (each producing just 2 units).
France produced 90 units of electricity in 1980. Each coal and natural gas had a cut of 25 units. Oil, nuclear power and hydro power have respectively contributed 20, 15 and 5 units. By 2000, use of nuclear power as an electricity source had considerably increased to 126 units (about 70 percent of total production). Each of the Coal and oil produced 25 units and natural gas and hydro power together contributed just 4 units.
Overall, by 2000 coal was a main electricity source in Australia and France relied on nuclear power.
(200 Words)
.
نمونه نوشته شده توسط زبان آموزان دوره مهرماه 1399
The charts provide information on the amounts of produced electricity by five types of fuel sources in 1980 and 2000 in Australia and France. (24 words)
Coal was the major source of electricity production in Australia. In 1980, 50 units of electricity was produced by coal and the remainder by hydro power and natural gas, each generated 20 and oil merely 10 units. By 2000, coal had become the dominant source and produced approximately three fourth of the entire production. The amount of electricity produced by hydro power increased to 36 units, however, other fuel sources remained negligible. (72 words)
Nonetheless, hydro power was the minor source of electricity production in France. In 1980, 70% of the whole production belonged to coal, natural gas and oil with 25, 25 and 20 percent respectively. The remaining 20 units were produced by nuclear (15 units) and hydro power (5 units). Significantly, the whole electricity generation doubled (180 units) twenty years later. In 2000, France heavily relied on nuclear power to produce electricity (126 units). Whereas it slightly used other fuel sources for electricity production, using coal and oil remained nearly unchanged. (89 words)
Overall, both countries experienced a dramatic surge in electricity generation but each exploited different fuels as the principal source. (19 words)
Total Words: 204
.
.
نمونه رایتینگ pie chart – بیشتر بخوانید
1000 ویدئوی آموزش زبان انگلیسی

دانلود 5000 پادکست آموزش زبان انگلیسی

.