


سمپل رایتینگ تسک 1 نمره 9
سمپل رایتینگ تسک 1 نمره 9 – نمودار خطی (Line Graph)
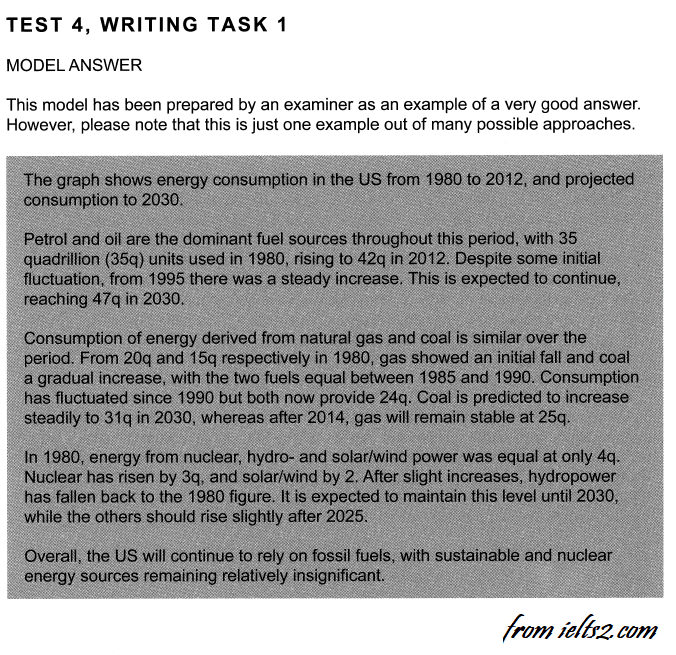
در این صفحه یک نمونه سوال رایتینگ آیلتس تسک 1 از نوع نمودار خطی یا Line Graph از کمبریج آیلتس 9 تست 4 به همراه 2 نمونه پاسخ برای نمره 9 و نمره 7 ارائه شده هست. نمونه نمره 9 توسط اگزمینر تنظیم شده و در پایان همین کتاب در دسترس می باشد و نمونه نمره 7 توسط مهندس ابوالقاسمی با نمره 8 آیلتس آکادمیک به عنوان یک نمونه ساده برای آموزش زبان آموزان گرامی تنظیم شده است.
اگر با تسک اول رایتینگ آیلتس آکادمیک آشنایی ندارید پیشنهاد میکنیم ویدئو و توضیحات مربوط به آموزش گام به گام نوشتن رایتینگ آیلتس Task 1 که به صورت کاملا رایگان در دسترس هست را حتما دنبال فرمایید.
تمامی منابع سایت به همراه هزاران کتاب دیگر در بزرگترین کانال های دانلود زبان انگلیسی و آیلتس در تلگرام با نشانی (https://t.me/ielts2official) و (https://t.me/ielts2download) در دسترس شما عزیزان می باشد.
.
نمونه رایتینگ تسک 1 آکادمیک – نمونه نوشته شده توسط مدرس در سطح نمره 7 تا 7.5
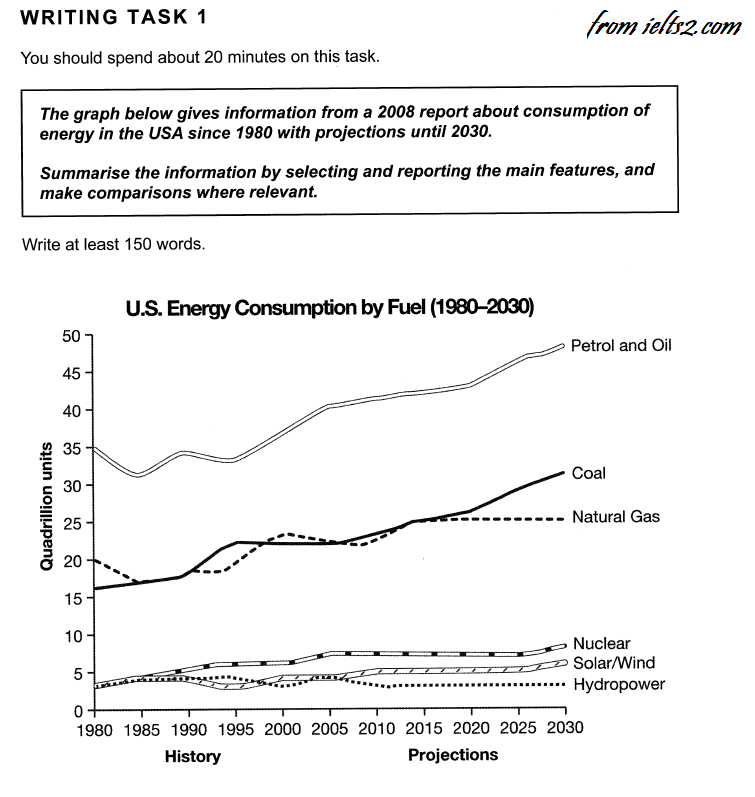
The graph illustrates 6 different types of fuel that are consumed in the USA between 1980 and a prediction for 2030.
Overall, petrol and oil are the most demanded fuel, with increasing consumption and the least consumed ones are renewables and nuclear power with no increase.
In 1980, the consumption of petrol and oil was 35 Quadrillion units(QU), which shows some fluctuation over the next 15 years, before beginning to increase continuously to 43 QU in 2008 and is predicted to peak at under 50 QU in 2030.
Coal and natural gas started at 16 and 20 QU in 1980. While both showed a moderate increase with some fluctuations up to 2008 at about 23 QU, natural gas is predicted to stabilize at 25 QU while a surge to a peak of 30 QU is expected for coal in 2030.
Nuclear, solar/wind and hydropower had the least consumption in the US in the beginning in 1980 at only about 3 QU, which continues with a negligible rise for nuclear up to the end, while hydropower dips to 2 QU in 2005 and is expected to remain constant till the end of the period.
Total = 193 Words
.
.
نمونه رایتینگ تسک 1 آکادمیک – سطح نمره 9
.
نمونه نوشته شده توسط زبان آموزان دوره اردیبهشت 1400
The graph demonstrates the consumption of 6 various fuels in the USA between 1980 and 2008, and a prediction until 2030.
Although the consumption of oil and petrol showed some initial variation, it was the highest throughout this period. Surging from 35 quadrillion units (QU) in 1980 to 43 QU in 2008 and is expected to peak at 47 QU in 2030.
Coal and natural gas rose from 16 and 20 QU in 1980 to 23 QU in 2008. Natural gas is predicted to remain constant at 25 QU, while coal will show an upward trend and reach a peak at 30 QU in 2030.
Nuclear, solar/wind energy and hydropower were the least consumed fuel sources in 1980 at 4 QU. Nuclear grew to 8 QU in 2008, and is expected to stabilize in 2030. Although solar/wind energy and hydropower showed some fluctuations, they remained constant until 2008. Hydropower is predicted to remain stable at 4 QU, while a growth to a peak of 6 QU is expected for solar/wind energy in 2030.
Overall, despite some minor surge in usage of environmentally friendly fuel sources, it is speculated that the USA will continue to consume fossil fuels.
.
🔴 کلاس: آیلتس اردیبهشت ماه 1400
🔴 زبان آموز: مهزاد
🔴جلسه: سیزدهم
#feedback
1️⃣❌some initial variation ✅some initial variations
2️⃣❌this period. Surging from ✅this period, surging from
دلیل برای قطع کردن جمله وجود ندارد.
✅ رایتینگ خوبی هست و توضیحات در عین کوتاه بودن اصلی ترین جزئیات را بازتاب داده اند. دقت بفرمایید که نسخه اولیه رایتینگ شما طولانی تر از مقدار مجاز بود و ممکن است بدلیل کمبود وقت نمره شما را تحت تاثیر قرار دهد. سمپل نمره 9 این رایتینگ و دیگر سمپل های نمره 9 را با دقت زیاد بررسی کنید. همچنین کوشش کنید در هنگام نوشتن به پاراگراف بندی سمپل هایی که در دسترس دارید نگاه کنید و جمله های اصلی را پارافریز نکنید.
نمونه نوشته شده توسط زبان آموزان دوره فروردین 1399
The line graph provides information on the volume of fuel consumption in USA between the years 1980 and 2008 with a prediction until 2030. (24)
Petrol and oil consumption was the highest throughout the period, rising from 35 quadrillion units (QU) in 1980 to about 40 QU in 2008 and is predicted to reach a peak at 50 QU in 2030. (36)
Coal and natural gas grew from 16 and 20 QU in 1980 to about 23 QU in 2008. Natural gas is predicted to remain stable at 25 QU, whereas coal will increase to 30 QU in 2030. (37)
Nuclear, solar/wind and hydropower were consumed only 4 QU in 1980. Nuclear increased to 8 QU in 2008 and is expected to remain constant till 2030 whereas despite some fluctuation, solar and Hydropower remained constant till 2008. It is expected that Solar/wind consumption will reach 6 QU till 2030 while Hydropower will remain constant at 4 QU. (57)
Overall, total fuel consumption increased over these 28 years and is forecasted to increase In the future, too. The highest increase in consumption was for fossil fuel and similar behavior is expected in the future. (35)
(Total= 189 words)
.

.
نمونه سوال رایتینگ تسک 1 آکادمیک – بیشتر بخوانید
1000 ویدئوی آموزش زبان انگلیسی

از مبتدی تا آیلتس چند سال است؟

.
پیشنهاد جمله های حرفه ای تر رایتینگ آیلتس

20 خطای متداول دستوری زبان آموزان ایرانی

.