نمونه رایتینگ Line Graph – نمره 8
7 نوع سوال در تسک اول رایتینگ آیلتس آکادمیک وجود دارد. نمونه سوال رایتینگ تسک 1 بالا از تست چهارم کتاب کمبریج آیلتس 8 بوده و 2 نمونه پاسخ برای این سوال در دسترس زبان آموزان گرامی قرار میگیرد. نمونه ای در سطح نمره 7 تا 7.5 تنظیم شده توسط مهندس ابوالقاسمی با نمره 8 رایتینگ آیلتس می باشد. این رایتینگ از نمودارهای خطی یا Line graph می باشد و امیدواریم این سمپل ها در کنار ده ها نمونه پیشتر نوشته و منتشر شده در سایت ielts2 مورد توجه و استفاده شما عزیزان قرار گیرند.
.

نمونه نوشته شده توسط مدرس در سطح نمره 7 تا 7.5
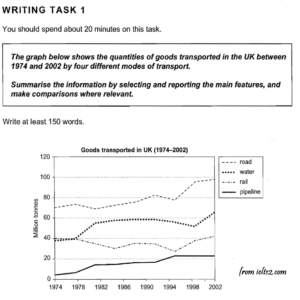
The graph reveals how much goods are transported in the UK via different modes from 1974 to 2002.
Overall, there is a considerable rise in all four ways of transportation except for railway, which remained constant.
Largest amount of goods was transported through roads over the whole period, with 80 Million Tons (MT) in 1974, and a rising trend with some fluctuation to just under 80 MT, and the final peak of just under 100 MT, which is the biggest figure over the whole period.
The goods transported by both water and rail were 40 MT in 1974, which remained unchanged for a year. Over the next few years, while the figure for water started to rise to a constant level of about 60 MT up to 1990, respected figure for rail had fallen a few MT by the same year. Between 1990 and 2002, both the figures started to improve. The figure for water finally hit a peak of over 60 MT, while figure for rail climbed back to initial figure.
Pipeline transported only 2 MT in 1974, with a gradual improvement and a peak of 21 MT in 1995, following a period of stability to 2002.
Total = 198 words
.
نمونه نوشته شده توسط فاطمه ح از زبان آموزان دوره آبانماه 1401
The graph illustrates how much goods were transported by four methods of transportation in the UK over a 28-year period.
Overall, the amount of goods transported by road is the largest over the period, while the lowest amount of goods transported is related to pipeline system.
The amount of goods transported by road started at the lowest level of 70 million tones (MT) in 1975. By 1995, the figure had shown some fluctuations. Then it rose from just under 80 MT, in 1995, to about 100 MT, at the end of the period.
At the beginning of the period, using water and rail transport was the second popular form among the four modes. The amount of goods transported began at roughly 40 MT and remained constant for a year. Then this figure for rail transport showed some variations, and reached the initial figure in 2002. The number of goods transported by water saw a considerable rise to under 60 MT in 1980, staying almost unchanged for a few years, dipping to about 55 MT in 1998, then peaking at approximately 64 MT in 2002.
The amount of goods transported by pipeline was 2 MT in 1974. By 1995, this number had reached a peak at 21 MT gradually, then remained stable until the end of the period.(199)
.
نمونه نوشته شده توسط زبان آموزان دوره تیرماه 1399
The graph illustrates the amount of goods transported by different ways of transport in the UK from 1974 to 2002. (20)
Overall, it is noticeable that the quantities of goods transported by all modes of transport increased except for rails, that remained constant. (22)
During the period, the biggest amount of goods was transported by roads, with almost 70 Million Tons(MT) in 1974. Despite some fluctuation, it increased gradually to reach approximately 80MT in 1995 and then it rose sharply during four following years, before peaking at just under 100MT in 2002, which was the largest amount among all categories. (56)
In 1974, the goods transported by water and rail were about 40MT and their amount almost remained constant for four following years. Then the figure for water, despite a slight downward trend during 1990 to 1994, increased to peak at 65MT in the final year, while figure for railway started to decrease with some fluctuation and reached 25MT in 1995, before rising to the same level of 1974 in the last year. (72)
Furthermore, amount of goods transported by pipeline was the least among four categories, with 4MT in 1974. Then it rose slightly to reach just over 20MT in the last year. (30)
Total words=200
.
#feedback
1️⃣❌some fluctuation✅some fluctuations
.
نمونه رایتینگ نقشه آیلتس Task 1 نمره 8
.
آموزش رایتینگ ایلتس سایمن، تسک 1 نمودار خطی
.
نمونه رایتینگ Line Graph آیلتس – بیشتر بخوانید
در پایان میتوانید برای دریافت جدیدترین کتاب ها و جزوه های آیلتس در کانال دانلودی منابع آیلتس (https://t.me/ielts2official) و همچنین برای انجام تمرین های روزانه در گروه تصحیح رایتینگ آیلتس (https://t.me/ielts2Group) ما همراه باشید.


2 پاسخ
وقت بخیر استاد، عذرمیخوام این عبارت ها درسته؟
1.the figure of rail mode of transprtation
2. the following four years or four following years?
توی لانگمن figure of هست اما figure for نیست.
درود
the figure of rail باید باشه یا rail accounted for
2 هر دو درسته
3 هر دو درسته