نمونه رایتینگ آیلتس آکادمیک تسک 1 – Pie Chart نمره 9
مجموعه ای از نمونه رایتینگ های آیلتس آکادمیک تسک 1 در سطح نمره 9 به همراه نمونه های ساده تر در سطح نمره 7 توسط مهندس ابوالقاسمی با نمره 8 آیلتس آکادمیک تنظیم شده و در سایت ielts2 به صورت رایگان در دسترس زبان آموزان گرامی قرار گرفته است. نمودار دایره ای بالا از کتاب کمبریج آیلتس 8 تست 2 در اینجا آورده شده است و امیدواریم سمپل های نمره 9 و 7 راهنمای زبان آموزان عزیز باشد.
شما عزیزان میتوانید برای تعیین سطح رایگان رایتینگ در گروه ielts2 در تلگرام اقدام بفرمایید: @ielts2group
.
نمونه پاسخ مدرس به این سوال در سطح نمره 7 تا 7.5
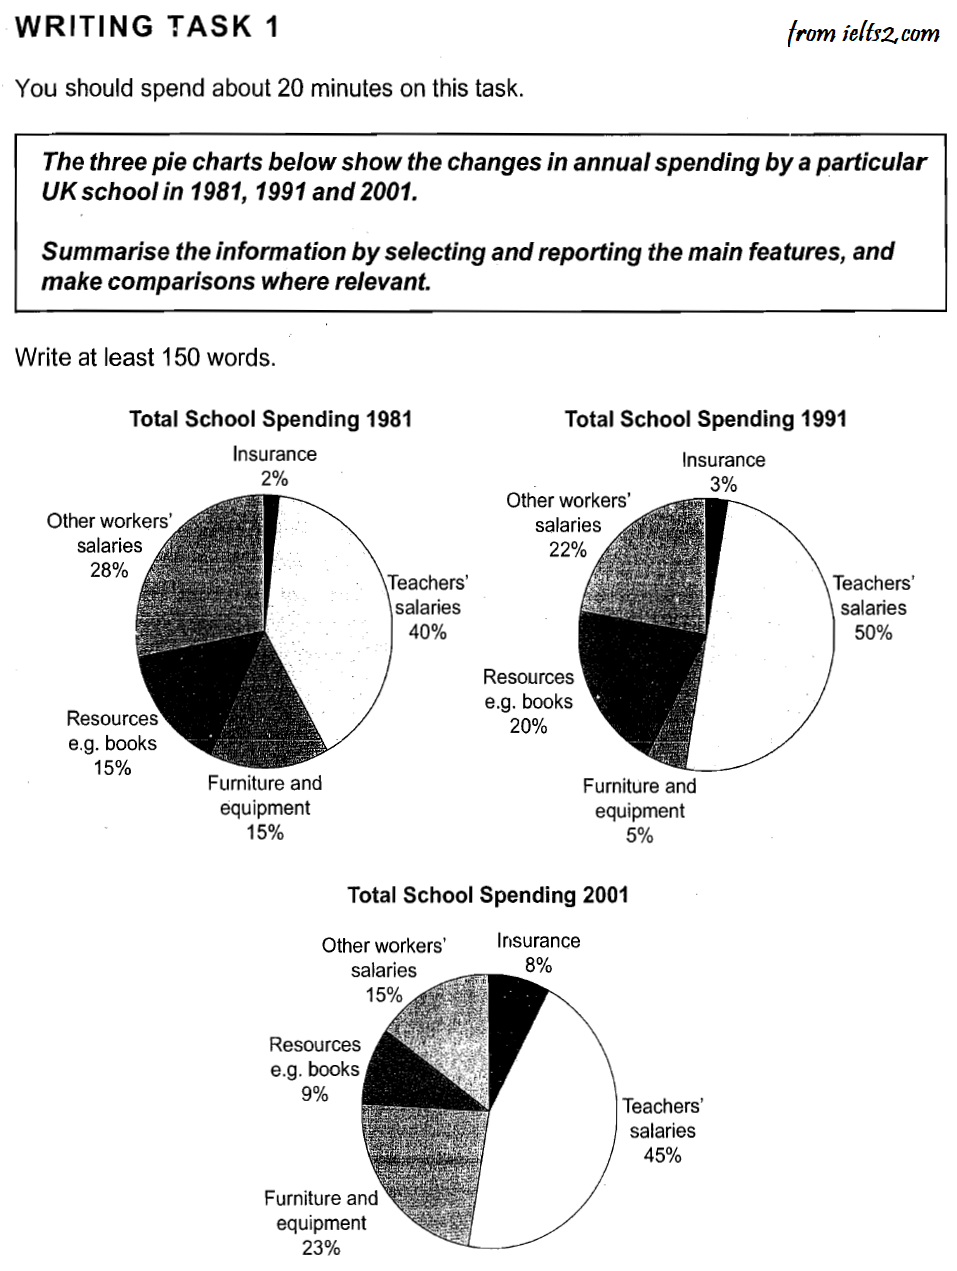
Three pie charts illustrate how a school in the UK spent its budget on different categories annually over three decades in 1981, 1991 and 2001.
Overall, 3 out of 5 categories saw a rather moderate rise in their level of expenditure except for the insurance but for other 2 categories that showed a fall, the change was more dramatic.
Payment to employees was by far the biggest share of the budget. While teachers’ payment moderately rose from 40 to 45 percent from 1981 to 2001, school paid other workers almost a third (28 percent) of its whole budget in 1981, falling to only 15 percent over the same period.
The budget set for both furniture and equipment on one hand and resources on the other appears to have the most significant fluctuations. As the former fell into 5 percent in 1991 and then rose more than 4 time (to 23 percent) in 2001, the latter had increased to one fifth of the whole expenditure by 1991, but dipped to less than 10 percent in 2010.
Insurance formed a negligible share of school’s whole expenses at only 2 percent, but it saw an improvement to 3 and to 8 percent in 1991 and 2001 respectively.
(Total = 204 Words)
.
.
نمونه پاسخ اگزمینر به این سوال در سطح نمره 9
.
نمونه رایتینگ تسک 1 جنرال – نمونه نمودار دایره ای
1000 ویدئوی آموزش زبان انگلیسی
دانلود 5000 پادکست آموزش زبان انگلیسی

.
بزرگترین مجموعه منابع گرامر زبان انگلیسی و آیلتس
.

2 پاسخ
متن سمپل نمره ۹:
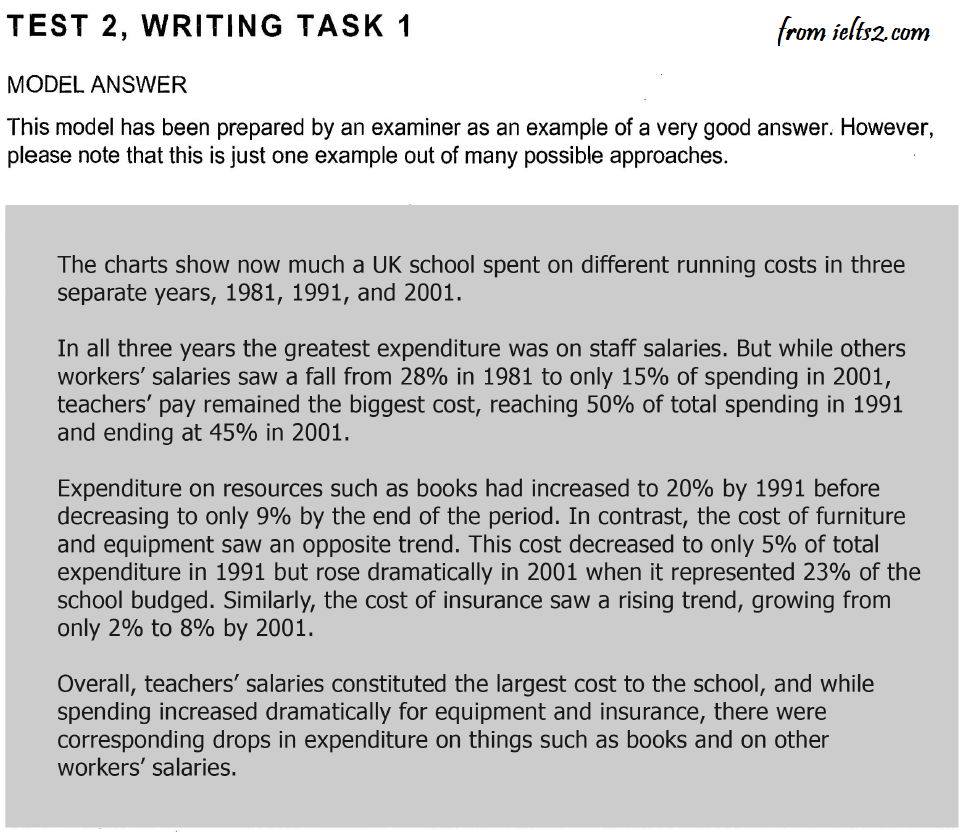
The charts show how much a UK school spent on different running costs in three separate years: 1981, 1991 and 2001.
In all three years, the greatest expenditure was on staff salaries. But while other workers’ salaries saw a fall from 28% in 1981 to only 15% of spending in 2001, teachers’ pay remained the biggest cost, reaching 50% of total spending in 1991 and ending at 45% in 2001.
Expenditure on resources such as books had increased to 20% by 1991 before decreasing to only 9% by the end of the period. In contrast, the cost of furniture and equipment saw an opposite trend. This cost decreased to only 5% of total expenditure in 1991 but rose dramatically in 2001 when it represented 23% of the school budget. Similarly, the cost of insurance saw a rising trend, growing from only 2% to 8% by 2001.
Overall, teachers’ salaries constituted the largest cost to the school, and while spending increased dramatically for equipment and insurance, there were corresponding drops in expenditure on things such as books and on other workers’ salaries.
داستان چی هست توضیح بفرمایید.