IELTS Task 1 Bar Chart three different kinds of emission Model Answer (March 2025)
Here we take a look at an IELTS Writing Task 1 Bar graph question which says “The graph below shows the three different kinds of emission” with a band +7 sample answer. This sample then will be further analyzed for its vocabulary, grammar and format, so we see how it has qualified for such band score. We also suggest over 1000 Band 9 IELTS Report Samples (Academic Writing Task 1) for free download. You may also go through our latest Task 1 questions with band 9 answer reported from around the world.
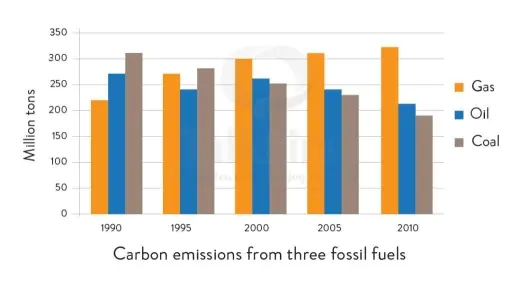
The graph below shows the three different kinds of emission sources (oil / coal / gas) of greenhouse gas in the UK.
Summarize the information by selecting and reporting the main features and make comparisons where relevant.
Sample Band +7 Response:
The bar chart illustrates the emissions produced by three fossil fuels—coal, gas, and oil—in Britain from 1990 to 2010.
Overall, gas emissions showed a steady upward trend over the 20-year period, whereas coal emissions declined significantly. Meanwhile, oil emissions experienced fluctuations before ultimately decreasing.
As depicted in the chart, gas emissions stood at over 200 million tons in 1990 and gradually increased throughout the two decades, peaking at approximately 325 million tons in 2010. In contrast, coal emissions started at their highest level, around 310 million tons in 1990, but steadily declined over the years. By 2010, coal emissions had dropped to about 190 million tons, making them lower than gas emissions.
Oil emissions exhibited notable fluctuations. Beginning at roughly 275 million tons in 1990, then decreased to around 240 million tons by 1995 before rising again to 260 million tons in 2000. However, over the following decade, oil emissions saw a significant decline, falling from 260 million tons in 2000 to below 200 million tons in 2010.
Word Count: 170
Free IELTS Sample Essays with Answers PDF
Here you can download over a 2000 sample IELTS Visuals (Charts, Graphs, Maps, …) in pdf written by former ielts examiners: PDF 1 / PDF 2 / PDF 3 / PDF 4 / PDF 5
More Content for You
نمونه رایتینگ آیلتس نمره 9 نوع 2 سوالی
6 ساختار فوق العاده مقایسه اعداد (با 30 مثال)
رایتینگ تسک 1 آکادمیک پای چارت 4 تایی
پرسش های اسپیکینگ آیلتس کمبریج 16 + پاسخ
Demand for gas and oil is increasing IELTS band 9 essay
Last But Not Least!
We suggest a useful IELTS website in English for more valuable IELTS sample essays on a range of topics. Our final suggestion is our writing free correction Telegram channel where you can send your own sample for evaluation and correction by an experience IELTS tutor with over a decade of practical experience in this matter.