سمپل رایتینگ نمودار میله ای
در تسک اول رایتینگ آیلتس آکادمیک مجموعا 7 نوع سوال وجود دارد که به صورت کامل و جداگانه در همین سایت آموزش داده شده و نمونه هایی برای آن ها ارایه شده است. سمپل ها و نمونه های نوشته شده برای رایتینگ های آیلتس به ویژه نمونه های ساده تر میتوانند برای زبان آموزان با پایه ضعیف تر بسیار سودمند باشند. در این صفحه چندین نمونه پاسخ در سطح نمره 7، 7.5 و 9 در دسترس هستند. نمونه های ساده تر توسط مدرس آیلتس(مهندس ابوالقاسمی) با نمره 8 رایتینگ آیلتس نوشته شده است که امیدواریم برای زبان آموزان گرامی سودمند باشد.
نکات مهم در گزارش نمودارها
Main Features
Starting Point
Ending point
Rapid increase
Rapid decrease
Low
peak
Fluctuations
Stability
.
How many words to write:
25 introduction + 25 Overview = 50 Words
50 Main paragraph + 50 Main paragraph + 50 Main paragraph = 150 words
Total = 200 Words
.
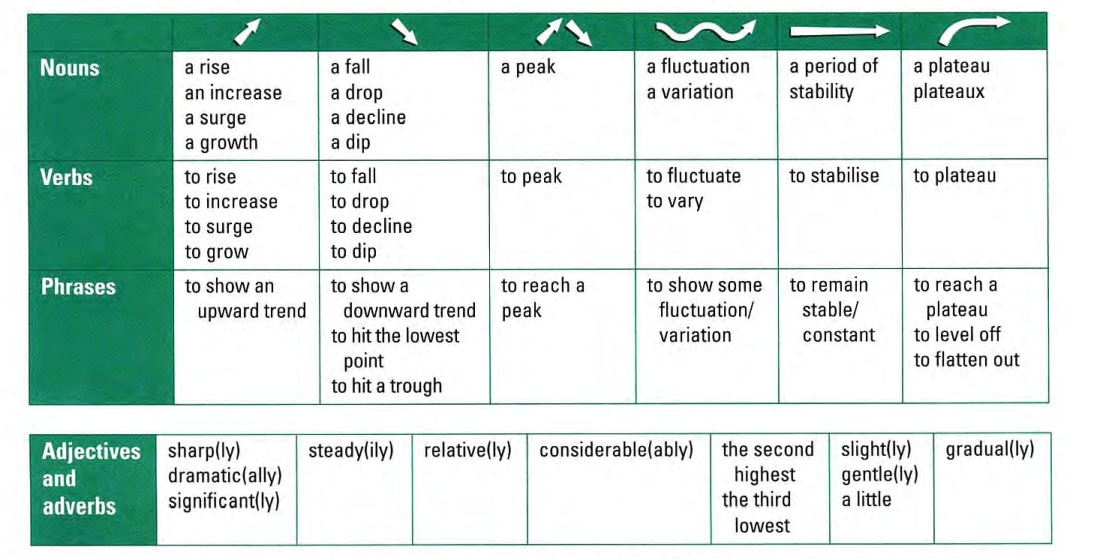
ساختارهای کاربردی برای نمودارهای خطی و میله ای تسک اول رایتینگ آیلتس آکادمیک
.
سمپل رایتینگ Bar Chart مدرس در سطح نمره 6.5
The chart shows how much people in UK used telephones in three different categories: Local line, National and international fixed line and Mobiles between 1995 and 2002.
In 1995, Local calls were more than 70 billion minutes. This number increased about 20 billion minutes to 90 in 1998. It then started to decrease to a 70 billion minutes again.
At the beginning, the number of minutes spoken using National and international fixed line was less that 40 billion minutes. This number only increased gradually for the next 7 years to the highest amount, over 60 billion minutes, in 2002.
The number of minutes spent on the Mobile calls were only a few billion minutes in 1995 and this rather small number increased slightly to just under 10 billion minutes in 1999. Next it surged dramatically to a peak of 45 billion minutes at the end of the period in 2002.
Overall, it seems the big difference in popularity among all three categories at the beginning started to diminish and at the final year all these categories had very similar level of popularity. (182 Words)
.
سمپل رایتینگ Bar Chart مدرس در سطح نمره 7 تا 7.5
The charts illustrates the total length of time spent on three groups of telephone calls in UK over a period of eight years from 1995 to 2002.
The most popular way of telephoning was local calls by fixed line in the beginning of the period in 1995 with slightly over 70 billion minutes, which started to rise gradually for the next four years to reach a peak of 90 million minutes, before falling back to the level of 1995.
Two other categories, National and International fixed lines and Mobiles, though quite different in popularity at the beginning(37 billion minutes for the former and only about 3 billion minutes for the latter), showed an increase all over the period, peaking at over 60 and 45 billion minutes respectively in 2002. This growth for mobile calls was quite slow for the first few years but in 1998 it took off and surged to a peak of 45 billion minutes at the end of the period.
Overall, while Local fixed line was the only category that showed a decline in the number of minutes, two other ones only experienced growth. Also, despite the considerable differences in popularity, all three categories were quite popular at the end and had the least difference at the end. (211 Words)
.

سمپل رایتینگ نمودار میله ای نوشته شده توسط اگزمینر در سطح نمره 9
در اینجا پاسخی که در پایان کتاب کمبریج آیلتس جلد نهم بعنوان پاسخ کامل نوشته شده توسط اگزمینر ارائه شده را میبینید. نمره این پاسخ نمره کامل یا 9 میباشد.
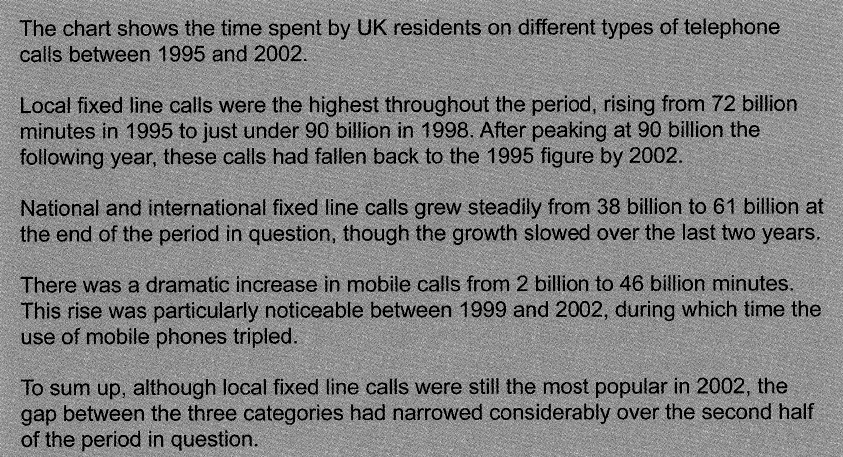
.
- نمونه رایتینگ خوب از زبان آموزان اردیبهشت 1400
The chart illustrates the amount of time devoted by UK residents to three various telephone calls over eight years between 1995 and 2002.
Local-fixed calls was the most popular way of telephoning throughout this period, surging from roughly 72 billion minutes in 1995. By1999, this figure had grown steadily to reach a peak at 90 billion. After that, this number fell back to the level of 1995.
National and international fixed line calls increased gradually all over the period, rising from 38 billion in 1995 to approximately 61 billion in 2002, but the rise slowed over the last two years.
The time spent on mobile calls grew considerably from 2 billion in 1995 to roughly 12 billion in 1999. After that, this figure showed a dramatic upward trend to a peak of about 46 billion minutes.
Overall, although in the end, local calls were still the most popular among the people, the other two categories experienced a sharp surge which narrowed the gap between them.
.
- سمپل رایتینگ نمودار میله ای خوب از زبان آموزان فروردین 1399
The bar chart depicts the amount of time spent by people in the UK on three different types of phone calls during the period between 1995 and 2002.
Overall, It is clear that local call has the highest figure of minutes in comparison with the other two categories. The lowest numbers on the chart refer to mobile calls, but this category also saw a significant increase in user minutes.
In 1995, UK residents spoke on landlines for just over 70 billion minutes for local calls and about half of that amount of time for national or international calls. In contrast, cell phones were only used for just under 5 billion minutes. Over the next four years, the figures for all three types of phone calls increased steadily.
Minutes spent on local calls peaked at approximately 90 billion in 1999, before falling back to its initial level again. In 2002, the number of minutes of national and international landline calls and mobiles showed an increase over the second half of the period and passed 60 and 45 billion minutes respectively. (179)
.
- نمونه رایتینگ خوب از زبان آموزان فروردین 1399
The bar graph compares total minutes of three types of calls in UK over a period of 8 years. (19)
In 1995, the number of minutes of local fixed line calls was about 70 billion. By 1999, it had showed an upward trend to reach a peak at 90 billion, before experiencing a fall to the 1995 figure again. It is observed that the popularity of local calls declined over the second half of the period. (56)
National and international fixed line calls showed a gradually increase all over the period, rising from just under 40 billion minutes in 1995 to about 60 billion minutes in 2002. (30)
Although mobile calls were the lowest throughout the whole period, it experienced a sharply increase. It was about 2 billion minutes in 1995 and rose to 46 billion minutes at the end of the period. (35)
Overall, although local calls were the most popular in this period, two other categories experienced a dramatic growth which reduced the gap between them. (24)
(total= 164 words)
.
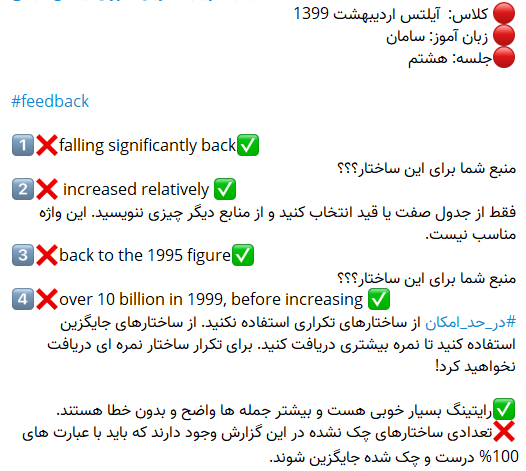
- سمپل رایتینگ نمودار میله ای خوب از زبان آموزان اردیبهشت 1399
The bar chart illustrates time spent on telephone calls in the United Kingdom over a period of 8 years from 1995 to 2002.
Local-fixed line calls were the popular way of telephoning with just over 70 billion minutes in 1995. This figure then rose steadily to reach a peak of 90 billion in 1999, before falling significantly back to the 1995 figure in 2002.
National and international calls increased relatively from just under 40 billion minutes in 1995 to 50 billion in 1999, before growing substantially by 10 billion minutes for the following two years in 2001. Then it rose a little to reach a peak of just over 60 billion in 2002.
Time spent on mobiles rose considerably from about 2 billion minutes in 1995 to just over 10 billion in 1999, before increasing dramatically to reach a peak of roughly 46 billion in 2002.
Overall, although the three categories increased at the beginning of the period, local-fixed line, regardless of its popularity, was the only category which showed a downward trend over the second half of the period.
(180 words)
.
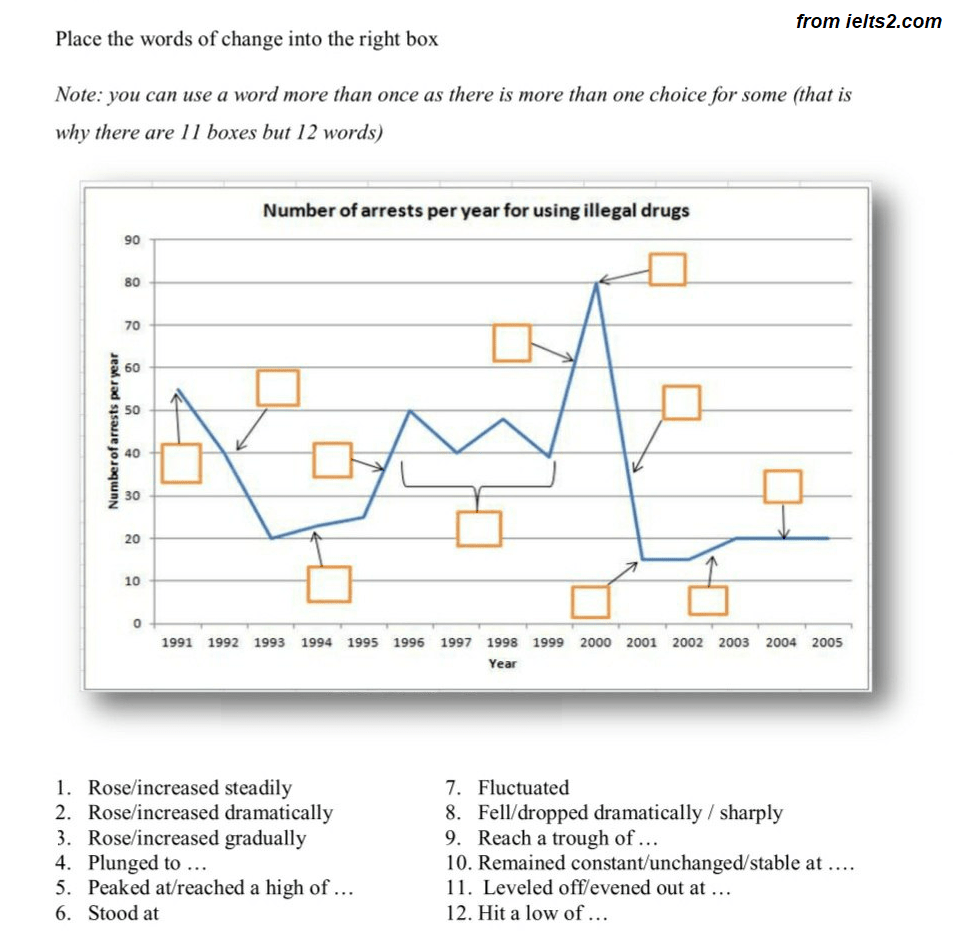
تمرین – عبارت های مناسب را برای هر نقطه از نمودار انتخاب نمایید.
ساختارهای کاربردی در سمپل رایتینگ نمودار میله ای
Verbs to describe trends:
• Increase (rapid, gradual, steady, sharp, significant, marginal)
• Decrease (gradual, steady, sharp, significant, marginal)
• Fluctuate
• Remain stable/constant/static
• Reach a peak
• Hit a low
• Experience a slump
• Plateau
2. Adjectives to describe changes:
• Dramatic
• Substantial
• Slight
• Moderate
• Marked
• Considerable
• Minimal
3. Nouns to describe changes:
• Rise
• Fall
• Growth
• Decline
• Increase
• Decrease
• Fluctuation
• Stability
• Plateau
4. Collocations to describe changes:
• An upward/downward trend
• A sharp/gradual increase/decrease
• A significant/marginal rise/fall
• A steady/stable/constant trend
• A fluctuating pattern
• A marked/considerable growth/decline
• A minimal/slight change
• A peak/low point
• A slump/recovery
• A plateau period
5. Introducing the Graph and Overview:
• The graph provides an overview of…
• The line graph depicts…
• The chart illustrates…
• It is evident from the graph that…
• As can be seen from the graph…
6. Highlighting Trends:
• Over the given period…
• Throughout the time frame…
• During the specified years…
• Across the decades…
• From the beginning to the end…
• Over the course of…
7. Comparing and Contrasting:
• In contrast to…
• Conversely…
• On the other hand…
• Similarly…
• Likewise…
• In comparison with…
• In a similar vein…
• Unlike…
• In comparison to…
8. Describing Increases and Decreases:
• There was a notable increase in…
• The trend witnessed an upward trajectory…
• Witnessing a steady rise…
• Experiencing a gradual decline…
• Demonstrating a sharp decrease…
• Experiencing a decline throughout the period…
• Peaking at…
• Reaching a high point of…
• Bottoming out at…
9. Highlighting Specific Data Points:
• Specifically, in the year…
• Notably, during…
• At the outset…
• At its peak…
• By the end of…
• As the graph progresses…
10. Summarizing and Concluding:
• To sum up…
• In conclusion…
• Overall…
• To recap…
• Taking all factors into consideration…
• In summary…
• All things considered…
• To conclude…
.
کلام پایانی
در اینجا سمپل رایتینگ نمودار میله ای را با هم دیدیدم و چندین نمونه پاسخ برای این نمودار ارایه شد. در پایان میتوانید برای دریافت جدیدترین کتاب ها و جزوه های آیلتس در کانال دانلودی منابع آیلتس (https://t.me/ielts2official) و همچنین در گروه تصحیح رایگان رایتینگ آیلتس (https://t.me/ielts2Group) ما همراه باشید.





The bar chart showed the total minutes of three different types of telephone calls spent by the UK populace over a period of 8 years (1995 to 2002). 28
Throughout the above-mentioned period, local-fixed line calls (LFLs) were the highest. It showed an increase from 72 billion minutes (BM) at the beginning to just under 90 BM in 1998. In the following year, it reached a peak of 90 BM; then these calls had steadily declined over four next years, so that it had fallen back to 1995 by last year (2002). 63
National and international-fixed line calls had steadily risen over this period from approximately 38 BM to just over 61 BM, while the growth slowed over the last year. 28
Although mobiles were lowest through these 8 years, it grew dramatically from negligible amounts (less than 3 BM) in 1995 to roughly 46 BM in 2002, i.e., the ratio of mobiles to LFLs increased from approximately 4% to more than 60%. 41
To conclude, LFLs was the most popular telephone call over the period in question, whereas the significant gap between this category and two others was narrowing. 26
لطفا در صفحه کلاس خودتان ارسال بفرمایید.