سمپل رایتینگ کمبریج آیلتس 17 آکادمیک تسک 1 تست 4
یک نمونه پاسخ برای کمبریج 17 آکادمیک تسک 1 را در اینجا بررسی میکنیم. پیش از این نمونه رایتینگ هایی در سطح نمره 7+ برای تسک اول تست 1 و 2 کمبریج آیلتس 17 آکادمیک خدمت عزیزان ارایه شد. در اینجا تست 3 مورد بررسی قرار گرفته و سمپلی برای نمره 7+ برای این نمودار میله ای ارایه میشود. این سمپل ها توسط مهندس ابوالقاسمی مدرس آیلتس با 15 هزار ساعت تجربه تدریس و نمره 8 آیلتس در مهارت رایتینگ نگارش شده که امیدوایم مورد پسند و استفاده علاقمندان قرار گیرد.
همچنین برای دانلود آموزش های رایگان ویدئویی مدرس های برجسته آیلتس میتوانید این صفحه را دنبال بفرمایید.
.
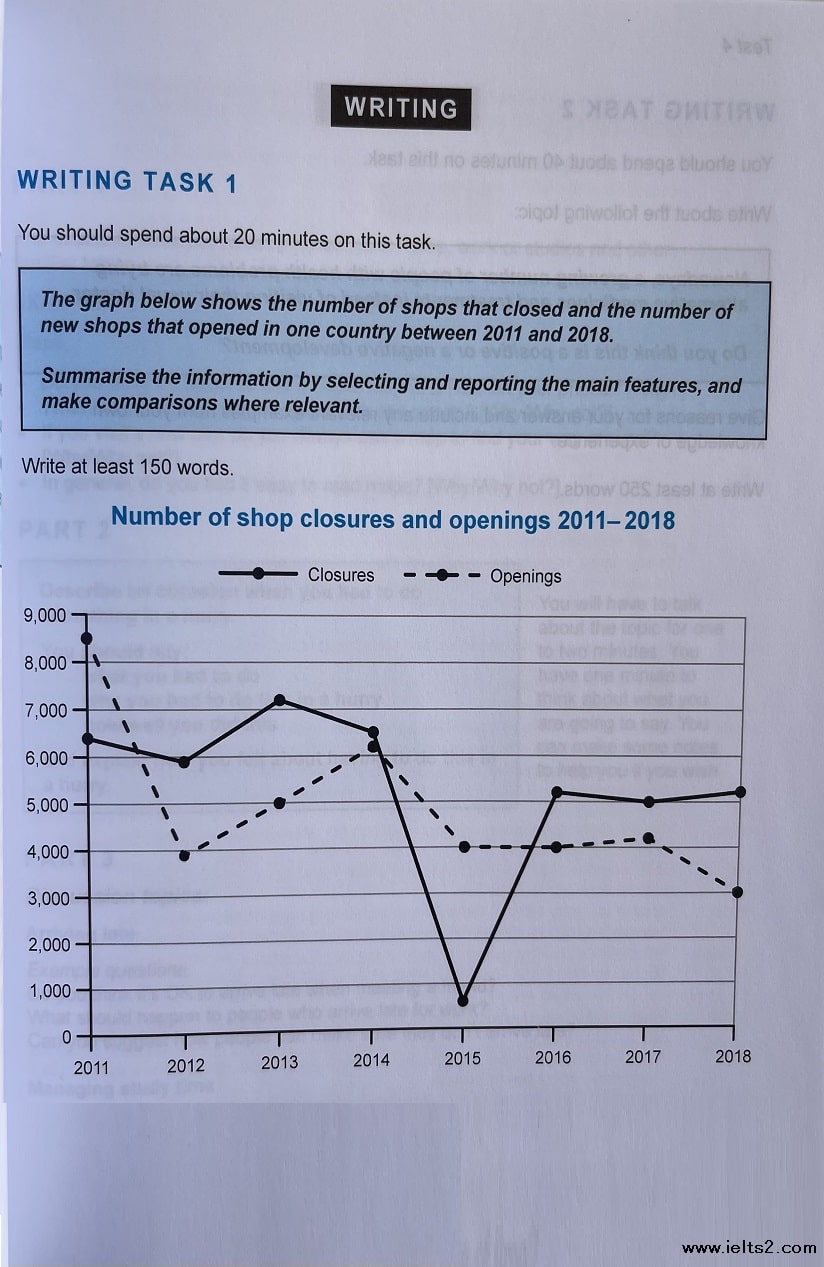
سوال رایتینگ کمبریج آیلتس 17 تست 4 – نمودار خطی (Line Graph)

نمونه نوشته شده نمره 7+ توسط مدرس:
The line graphs illustrate how many shops started and terminated their business in a given country over a period of 8 years between 2011 and 2018. It appears in both cases there has been a drop over these years.
Openings and closures started at their highest level at the beginning of the period in 2011, being almost 8.5 and 6.5 thousand. The former experienced a huge initial drop to a low of just under 4 thousand in the following year (2012), and despite a fluctuation between 2012 and 2015, it remained at this level and only experienced a final drop at the end in 2018 to an all-time low of 3 thousand. However, closures had more dramatic fluctuations between 2012 and 2016, hitting a low of less than a thousand cases but finally jumped back to only a thousand cases less than the initial number and leveled off at this number (about 5 thousand) till the final year.
Overall, while the fluctuations for closures were more dramatic, the figure remained to its initial level but in case of openings, the fluctuations were smaller but the whole drop was more dramatic to almost a third of initial figure.
Total = 197 Words
.
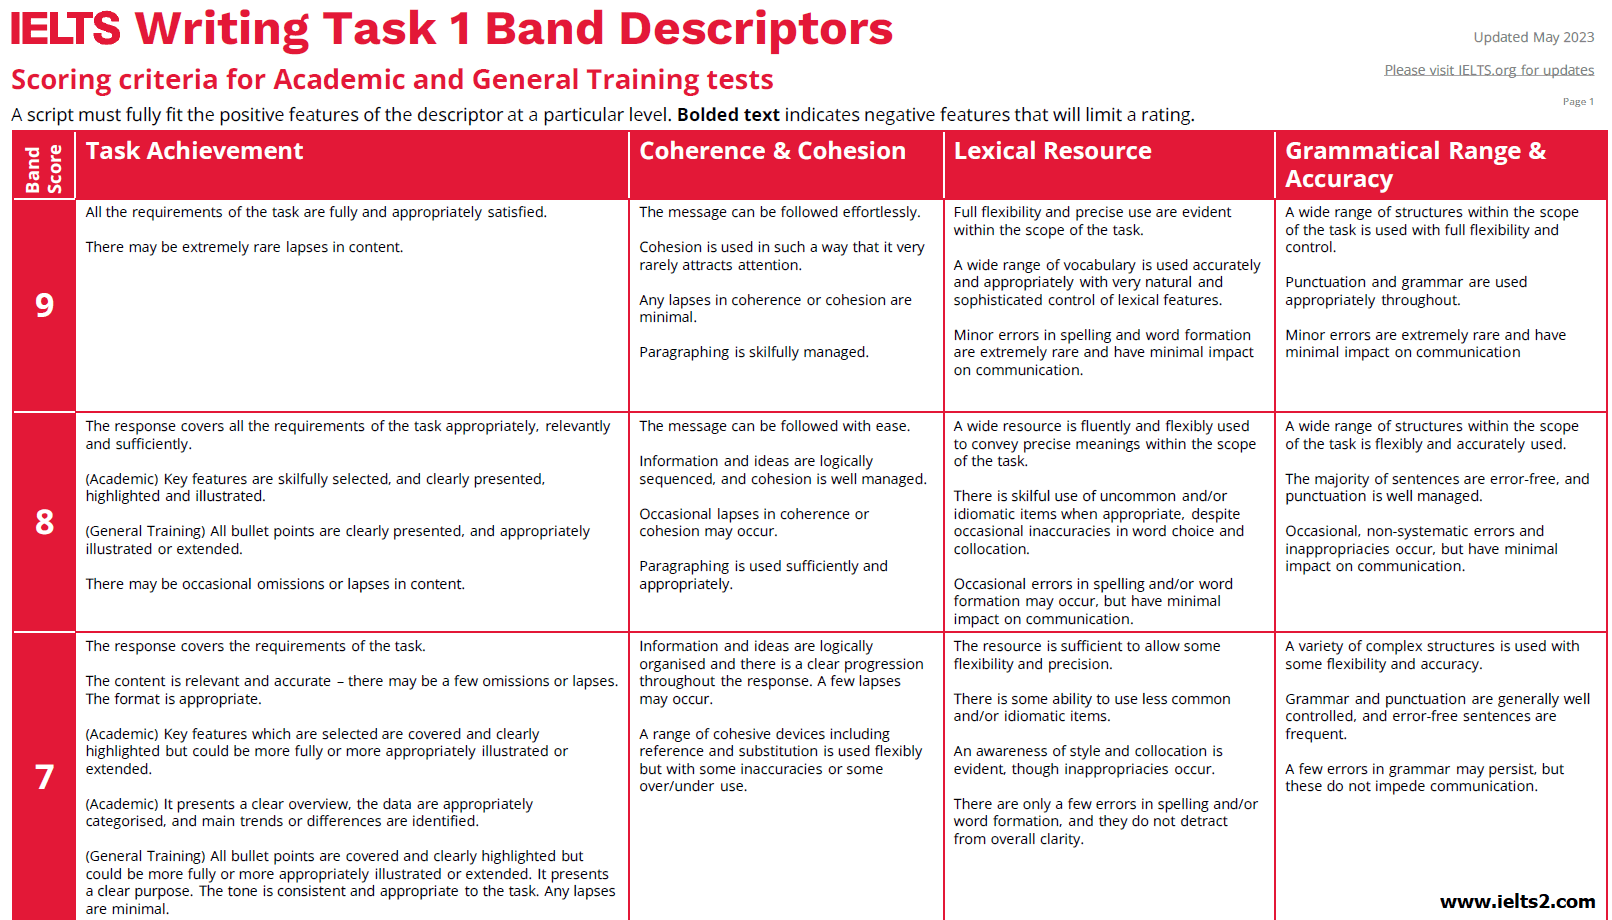
جدول معیارهای تعیین نمره رایتینگ آیلتس تسک 1:

.
دانلود خودآموزهای رایگان رایتینگ آیلتس در کانال تلگرام دانلود ما:
https://t.me/ielts2download


