نمونه Line Graph ساده آیلتس درباره School Children Time Spent on TV Computer
در این صفحه یک نمونه نمودار خطی ساده آیلتس (Line Graph) را میبینیم که نمونه پاسخ هایی برای آن توسط مدرس آیلتس با نمره 8 نوشته شده است. این پاسخ با وجود ساده بودن کامل بوده و تمامی ویژگی های لازم برای دریافت نمره 7 را داراست. با اینهمه، این سوال جنبه تمرینی داشته و نمونه سوالات روز آزمون آیلتس چالش بسیار بیشتری خواهد داشت.
نمونه نمودار خطی ساده آیلتس Average Time Spent School Children on TV Computer

نمونه پاسخ مدرس بدون خطای دستوری و واژگان مناسب
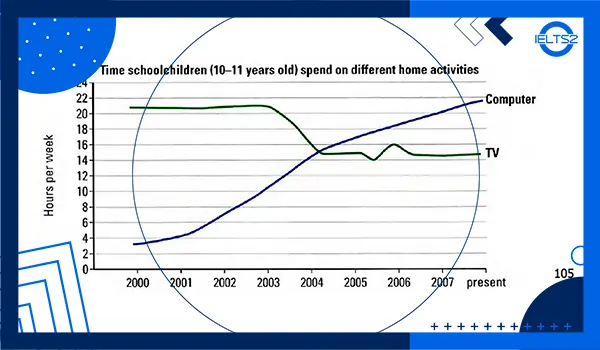
The graph shows the average weekly time spent by children at the age of 10 to 11 on two different leisure activities (TV and computer) at home. (27)
Schoolchildren spent just under 4 hours a week on computer at the beginning of the period in 2000. This number increased steadily for the next 4 years to 15 hours in 2004. Then it increased more slowly during the following 4 years to 2008 to reach a peak of almost 22 hours per week. (54)
Time spent on TV was much higher compare to computer at the beginning of the period. It started at 21 hours in 2000 and stayed the same until 2003. At this time it showed a downward trend and fell to 15 hours in 2004. During the next 4 years up to the end of period in 2008, despite some fluctuations, it remained stable at this level. (66)
Overall, it seems children’s preference for these two pastime activities changed dramatically and during this nine-year period they have reversed. (20)
(167 Words)
نمونه پاسخ خوب یکی از زبان آموزان دوره آیلتس اردیبهشت 1400
The line graph illustrates the average weekly time spent on two different leisure activities (TV and Computer), from 2000 until 2008 by children at the age of 10 to 11.
Using the computer was not a favorite hobby among children at first. They spent just 3 hours per week on computers in 2000. This time grew slowly to approximately 15 hours during the next 4 years and then with a sharp upward climb reached a peak of almost 22 hours a week at the end of this period.
School children preferred TV to computers in 2000. They devoted 21 hours to watching TV at the beginning of the period and it stayed the same until 2003. After that, it sharply fell to 15 hours per week through 1 year in 2004. Although there were some fluctuations during the next 4 years, it remained stable at this level until the end of the period in 2008.
Overall, at first, TV was an interesting hobby for school children and they spent most of their free time on TV compared to computers. But these two pastime activities dramatically reversed during this nine-year period.
.
نمونه پاسخ خوب یکی از زبان آموزان دوره آیلتس بهمن 1399
The given line graph illustrates the average weekly time spent by schoolchildren on two different pastime activities (TV and computer) over a period of 9 years. (26)
The time spent on computers started at approximately 3 hours per week in 2000. After that, it showed a significant upward trend to reach about 15 hours a week. Then it increased again but more slowly than in the past. In 2008 it rose to a peak of 21 hours a week that was the biggest number over the period shown. (60)
Schoolchildren devoted 21 hours a week to TV at the beginning of this period in 2000. This figure had a period of stability from 2000 to 2003 and after that, it hit the lowest point of 15 hours a week in 2004. Even though there are some minor variations between 2004 and 2008, it remained constant throughout this period. (59)
Overall, at first, TV was more favored compared to the computer. Despite the fact that TV remained popular among them, their favorite leisure activity reversed in the latest years. (28)
Total words:178
.
#feedback
✅گزینش اطلاعات اصلی و گزارش این اطلاعات به خوبی انجام شده.
✅ساختارهای دستوری و واژگان وضعیت مطلوبی دارند.
✅پیوستگی جمله ها و قابلیت دنبال کردن آن ها مناسب هست.
.
نمونه پاسخ خوب یکی از زبان آموزان دوره آیلتس فروردین 1399
The graph shows the average weekly time spent on various activities done at home by schoolchildren between the ages of 10 and 11 from 2000 to 2008.
Using the computer, was not favored at the beginning of this period in 2000 with roughly 4 hours per week, (hrs/wk), however, it slightly rose until 2001, and then it witnessed a significant increase by approximately 10 hrs/wk until 2004. It reached its highest point during the period in 2008 with 22 hrs/wk.
As the figures depict, the children strongly preferred TV to computer in 2000 since they watched TV 21 hrs/wk and that remained constant for three years after that, but it sharply fell through 1 year by 6 hrs/wk, and reached 14 hrs/wk in 2004. Despite some minor fluctuations, the time the schoolchildren spent watching television remained stable by 14 hrs/wk, until the end of the period in 2008.
Overall, while in the initial years of the period, watching TV occupied most of these children’s leisure time, they increasingly devoted more and more time to computers in these nine years. However, the popularity of TV did not markedly decline.
(188 Words)
آشنایی بیشتر با نمودار های خطی آیلتس
نمودارهای خطی (Line Graphs) یکی از رایجترین انواع سوالات در بخش رایتینگ تسک ۱ آیلتس (آکادمیک) هستند. این نمودارها تغییرات دادهها را در طول یک بازه زمانی نشان میدهند. برای رسیدن به نمره خوب (۶.۵ به بالا)، باید ساختار و ویژگیهای خاصی را در گزارش خود رعایت کنید.
انواع نمودارهای خطی در آیلتس:
۱. نمودار خطی ساده (Single Line Graph):
فقط یک خط دارد (مثلاً تغییرات جمعیت یک کشور در ۵۰ سال).
تمرکز بر روند کلی (افزایشی، کاهشی، نوسانی).
۲. نمودار خطی چندگانه (Multiple Line Graph):
چند خط با رنگ/طرح متفاوت (مثلاً مقایسه فروش ۳ محصول در ۱۰ سال).
باید مقایسه و ارتباط بین خطوط را تحلیل کنید.
ویژگیهای ضروری برای نمره بالا در رایتینگ نمودار خطی:
۱. مقدمه (Introduction) – بازنویسی سوال به زبان خودتان
جمله سوال را پارافریز کنید (با تغییر واژگان و ساختار).
مثال:
سوال: “The graph below shows the changes in the number of tourists visiting a museum between 1980 and 2020.”
پارافریز: *”The line graph illustrates how the number of museum visitors fluctuated over a 40-year period from 1980 to 2020.”*
۲. بررسی کلی (Overview) – مهمترین بخش برای نمره ≥۶
۲-۴ ویژگی کلیدی را بدون جزئیات بنویسید:
روندهای اصلی (افزایش/کاهش/ثبات).
نقاط اوج/حفره (بالاترین/پایینترین مقدار).
تفاوتهای چشمگیر بین خطوط (در نمودارهای چندگانه).
مثال:
“Overall, the number of visitors rose significantly, despite some fluctuations. Additionally, the most dramatic growth occurred between 2000 and 2020.”
۳. بدنه (Body Paragraphs) – جزئیات + مقایسه
دادهها را گروهبندی کنید (مثلاً بر اساس دورههای زمانی یا روندهای مشابه).
از اعداد و سالها دقیق استفاده کنید (مثلاً “peaked at 2 million in 2010”).
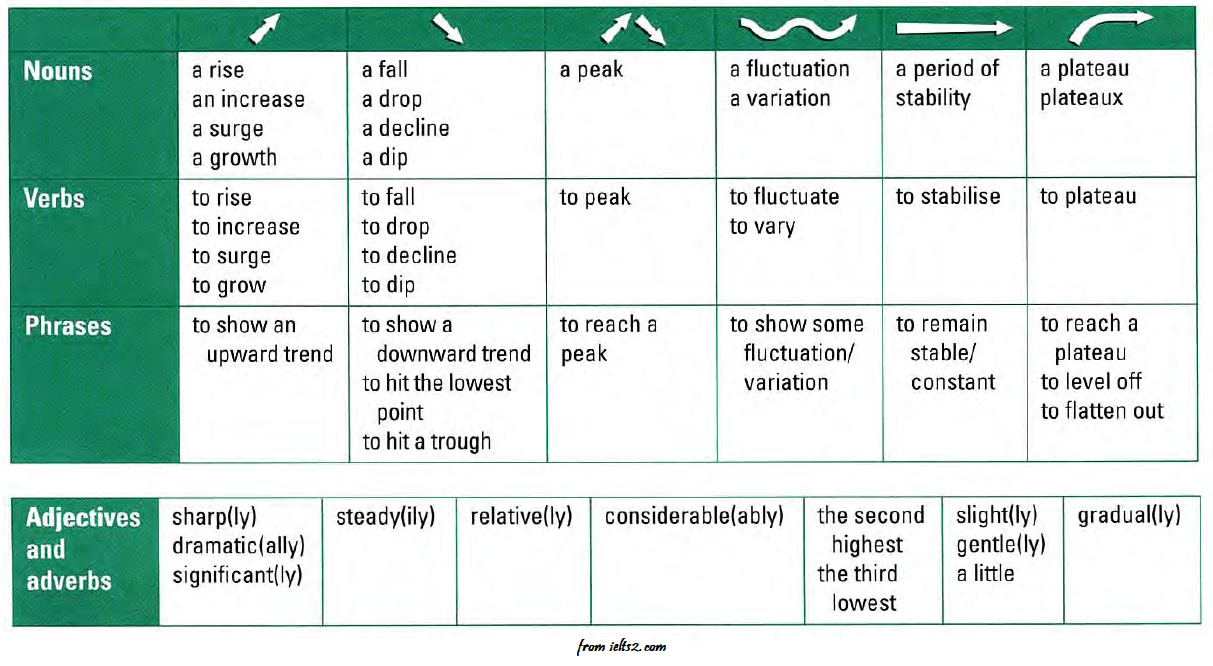
از واژگان متنوع برای توصیف تغییرات استفاده کنید:
افزایش: rose, climbed, surged, reached a peak
کاهش: declined, dropped, plummeted, hit a low
نوسان: fluctuated, stabilized, remained steady
برای مقایسه خطوط: “while X increased, Y decreased sharply”
۴. زبان و گرامر (برای نمره ≥۷)
حال کامل و گذشته ساده: “The figure has risen since 1990” / “It was highest in 2005”
صفات/قیدهای شدت: slight → gradual → sharp → dramatic
جملات پیچیده: “Although the trend was upward, there was a brief dip in 1995.”
نمونه ساختار گزارش نمودار خطی آیلتس (۴ پاراگراف):
۱. Introduction: پارافریز سوال.
۲. Overview: ۲ جمله اصلی (بدون عدد!).
۳. Body 1: جزئیات دوره اول + مقایسه (اگر چند خط وجود دارد).
۴. Body 2: جزئیات دوره دوم + نقاط قابل توجه.
نکات طلایی برای دریافت نمره بالا در نمودار های ساده آیلتس:
✅ از کپی کردن سوال خودداری کنید (پارافریز ضروری است).
✅ Overview را بعد از مقدمه بنویسید (اگر آخر بنویسید، ممتحن ممکن است متوجه نشود!).
✅ از حدس زدن علت تغییرات خودداری کنید (فقط دادهها را توصیف کنید).
✅ تنوع واژگان و ساختارها را حفظ کنید (تکرار کلمات نمره را کاهش میدهد).
با رعایت این اصول، بهراحتی میتوانید در رایتینگ تسک ۱ آیلتس نمره ۷ یا بالاتر کسب کنید.
ساختارهای ضروری برای نمودار خطی آیلتس آکادمیک
دیدن جدول و ساختارهای کاربردی بیشتر
نمونه توضیح ساده برای تغییرات مربوط به نمودار بالا برای Computer
The time spent on TV was by far the biggest number but showed a decline over the years. It started at 21 hours per week in 2000. This figure remained stable for the next three years and then fell to 15 hours per week in 2004. Between 2004 and 2008, the present time, it remained unchanged at this level despite some fluctuations.
نمونه توضیح پیشرفته تر برای همین تغییرات
Starting at just over 20 hours a week, TV had the greatest figure in 2000 showing a period of stability for a couple of years, before dropping to 15 hours a week in 2004, where it is surpassed by time spent on computer. By 2008, it had remained relatively stable at the same level despite some fluctuations in about 2006.
.
it witnessed….
…. stood at only….
عبارت های مناسب را برای هر نقطه از نمودار انتخاب نمایید.
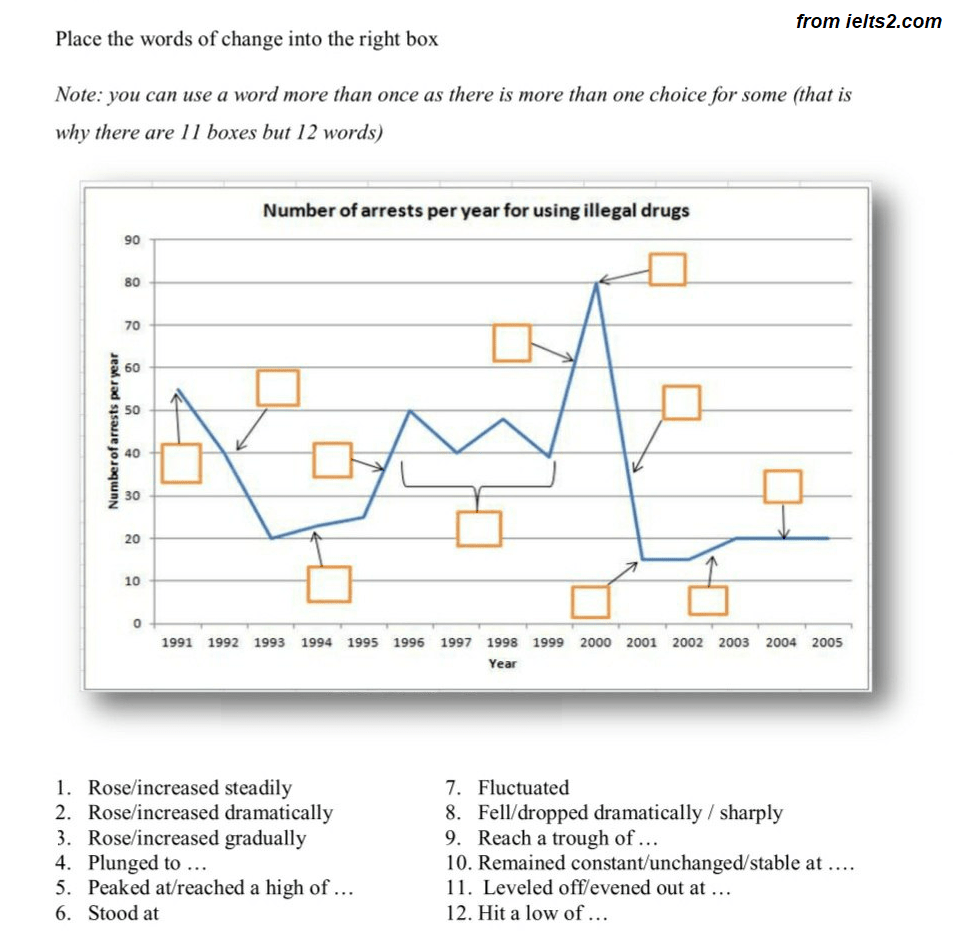
جاهای خالی را با واژگان مناسب پر کنید.

مطالبی برای مطالعه بیشتر
آموزش و نمونه نمودارهای خطی رایتینگ آیلتس
More and more adults spend time playing computer games
تحلیل رایتینگ تسک 1 – جدول و نمودار خطی
Some people believe computer games are useful for people while
اسپیکینگ آیلتس موضوع کامپیوتر (سمپل نمره 9)


Average Time Spent School Children on TV Computer
The graph displayed the mean weekly time spent by children at the age of 10 to 11 on two different free time activities (TV and computer) at home. (28 words)
The children spent over 20 hours on TV per week in 2000. This statistic remained stable for three years Then dropped to 15 hours per week in 2003. although a little variation between 2004 to 2008 but this stat remained unchanged at this period. (44 words)
In the beginning the computer wasn’t favorited tools among the children. Starting time spent with 3 hours per week in 2000. This number increased regularly up to 15 hours per week in 2004. Between 2004 and 2008 it was rose with gentle slope that period and reached to 21 hours per week in 2008. (54 words)
Overall, in the beginning, children’s preferred TV to computer and then this procedure changed, the computer become a popular means of entertainment for children after a few years.(28 words)
رایتینگ را در صفحه کلاس خودتان ارسال بفرمایید.
The average of spending time on computer and Tv programs by children during 2000toperesent is illustrated by the above graph obviously.Overall,regarding evidence wich is displayed by graph dealing with computer and Tv were a significant growht during2000to present period and watch ing Tv has been gradually decreased.Puplspeny around 4huor weekly on computer during 2000preiod .It had a slightly climb to15huor between 2004to2008then it minimally rised flowing 4years to 2008 to climb peak of 22hours per weekThe time that indicateed Tv was higher camper than computer first time in2000 although the number of Tv audience was high it maintained the a fluctuation during during 2004to2006Then it remained steady change flowing years.
رایتینگ را در صفحه کلاس خودتان ارسال کنید.
ضمنا رایتینگ تسک 1 شما نباید زیر 150 واژه باشد. بعد از تصحیح ارسال بفرمایید.