IELTS Model Band Score 9 for Bar Chart total manufacturing output in percentages in Asia
Here we take a look at a band 9 ielts writing task 1 question about “Bar Chart total manufacturing output in percentages in Asia” with a band 9 sample answer. This sample then will be further analyzed for its vocabulary, grammar and format, so we see how it has qualified for such band score. We also suggest over 1000 Band 9 IELTS Report Samples (Academic Writing Task 1) for free download. You may also go through our latest Task 1 questions with band 9 answer reported from around the world,
IELTS Bar Chart total manufacturing output in percentages in Asia
The bar graph shows the total manufacturing output in percentages in Asia, Europe, and the rest of the world.
Summarise the information by selecting and reporting the main features, and make comparisons where relevant.
📌 Sample Answer (Band 9)
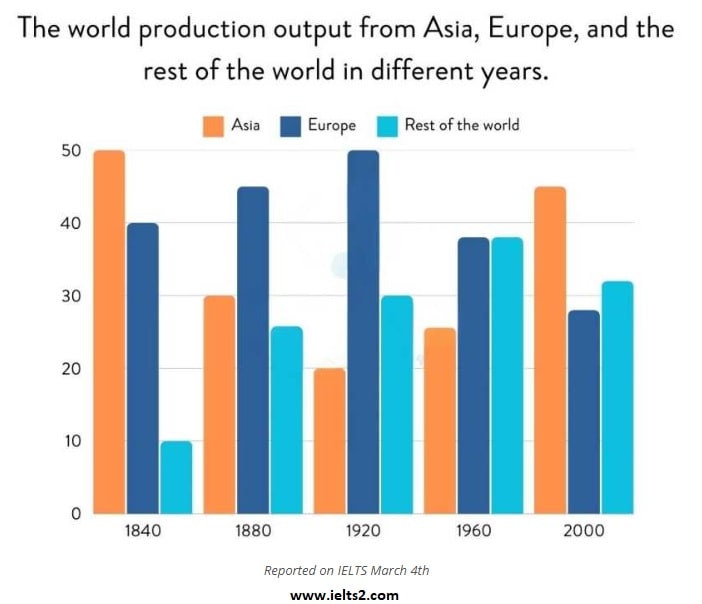
The bar chart illustrates the world production output from Asia, Europe, and the rest of the world in different years, namely 1840, 1880, 1920, 1960, and 2000.
Overall, the production output experienced significant shifts over the period. Asia started as the leading producer in 1840, while Europe dominated the output in 1920. However, by 2000, the production output became more balanced among the three regions.
In 1840, Asia had the highest production output, accounting for approximately 50%, while Europe produced around 35%, and the rest of the world contributed minimally. By 1880, Europe saw a substantial increase to just below 40%, overtaking Asia, whose output dropped to about 25%. The rest of the world showed a slight improvement, reaching around 15%.
The year 1920 marked the peak of Europe’s production, reaching the highest point in the entire period at approximately 50%. Asia’s output declined further, while the rest of the world had a moderate increase. In 1960, the production levels of Europe and the rest of the world were nearly the same, both around 30%, while Asia remained relatively low.
By 2000, Asia experienced a resurgence, reaching nearly 35%, while Europe and the rest of the world had comparable outputs of around 30% each. This shift indicated a more balanced distribution of production output across the three regions.
Free IELTS Sample Essays with Answers PDF
Here you can download over a 2000 sample IELTS Visuals (Charts, Graphs, Maps, …) in pdf written by former ielts examiners: PDF 1 / PDF 2 / PDF 3 / PDF 4 / PDF 5
More Content for You
کمبریج 15 نمودار میله ای تست 1 (Bar Chart)
نمودار دایره ای کمبریج 11 تست 1 (Pie Chart)
لغات آیلتس موضوع تولید (Production)
رایتینگ موضوع تولید (Discussion)
Last But Not Least!
We suggest a useful IELTS website in English for more valuable IELTS sample essays on a range of topics. Our final suggestion is our writing free correction Telegram channel where you can send your own sample for evaluation and correction by an experience IELTS tutor with over a decade of practical experience in this matter.