نمودار میله ای (Bar Chart) رایتینگ آیلتس آکادمیک
در اینجا یک نمونه سوال نمودار میله ای (بار چارت) از تسک 1 رایتینگ آیلتس از تست چهارم کتاب Official Cambridge Guide را با هم میبینیم. همچنین 2 نمونه پاسخ برای این سوال در دسترس زبان آموزان گرامی قرار میگیرد. یکی در سطح نمره 8 تا 9 که در آخر این کتاب به عنوان نمونه درج شده و دیگری نمونه ای در سطح نمره 7 تا 7.5 تنظیم شده توسط مهندس ابوالقاسمی با نمره 8 رایتینگ آیلتس. امیدواریم این سمپل ها در کنار ده ها نمونه پیشتر نوشته و منتشر شده در سایت ielts2 مورد توجه و استفاده شما عزیزان قرار گیرند.
آشنایی با نمودار های میله ای آیلتس
نمودار میلهای (Bar Chart) در آزمون آیلتس یکی از رایجترین انواع تسکهای رایتینگ تسک ۱ (Writing Task 1) است. در این بخش، شما باید دادههای ارائهشده را بهصورت واضح و ساختاریافته توصیف کنید.
انواع نمودار میلهای در آیلتس:
نمودار میلهای عمودی (Vertical Bar Chart):
میلهها به صورت عمودی نمایش داده میشوند.
معمولاً برای مقایسه مقادیر بین گروههای مختلف استفاده میشود.
نمودار میلهای افقی (Horizontal Bar Chart):
میلهها به صورت افقی نمایش داده میشوند.
معمولاً زمانی استفاده میشود که نام گروهها طولانی باشد یا تعداد گروهها زیاد باشد.
نمودار میلهای گروهبندیشده (Grouped Bar Chart):
چند میله در کنار هم برای مقایسه چند متغیر در یک گروه نمایش داده میشوند.
مثال: مقایسه فروش سه محصول مختلف در چهار فصل سال.
نمودار میلهای پشتهای (Stacked Bar Chart):
میلهها به صورت چند لایه روی هم قرار میگیرند تا سهم های مختلف را نشان دهند.
مثال: نمایش سهم بخشهای مختلف در درآمد یک شرکت در سالهای مختلف.
نکات کلیدی برای نوشتن پاسخ خوب برای میله ای آیلتس:
1. مقدمه (Introduction)
جمله اول را با پارافریز کردن سؤال شروع کنید (با کلمات خودتان موضوع را توضیح دهید).
مثال:
سؤال: The bar chart shows the percentage of people using different modes of transportation in a city from 1990 to 2010.
پارافریز: The bar chart illustrates the proportion of citizens using various means of transport in a particular city between 1990 and 2010.
2. بررسی کلی (Overview)
۲ تا ۴ نکته اصلی را که از نمودار مشخص است، بهصورت کلی بیان کنید.
مثال:
Overall, the use of cars increased significantly, while the popularity of bicycles declined over the period.
It is also noticeable that public transport remained the most common mode of travel throughout the years.
3. جزئیات (Details)
دادههای مهم را با مقایسه و ذکر ارقام توصیف کنید.
از کلمات ربطی مانند:
In contrast, However, Similarly, Meanwhile
از صفات و قیود برای نشان دادن تغییرات استفاده کنید:
Sharply, Slightly, Dramatically, Gradually
مثال:
In 1990, only 10% of people used cars, but this figure rose dramatically to 45% by 2010.
By contrast, bicycle usage, which stood at 25% in 1990, dropped to just 10% two decades later.
4. سازماندهی متن
دادهها را بهصورت منطقی گروهبندی کنید (مثلاً بر اساس بیشترین تغییرات یا بر اساس سالها).
هر پاراگراف را به یک ایده اصلی اختصاص دهید.
نکات نهایی نوشتن پاسخ برای نمودارهای میله ای و دریافت نمره بالا:
✅ از کلمات متنوع برای توصیف اعداد استفاده کنید (e.g., accounted for, represented, stood at).
✅ از جملات پیچیده (Complex Sentences) استفاده کنید.
✅ از بیان نظر شخصی یا تحلیل بیدلیل خودداری کنید (نمودار را فقط توصیف کنید).
✅ زمان صحیح را انتخاب کنید (اگر دادهها مربوط به گذشته است، از گذشته ساده استفاده کنید).
✅ حداقل ۱۵۰ کلمه بنویسید (ترجیحاً ۱۶۰-۱۸۰ کلمه).
یک نمونه سوال نمودار میله ای آیلتس
سمپل نوشته شده توسط مدرس در سطح نمره 7 تا 7.5
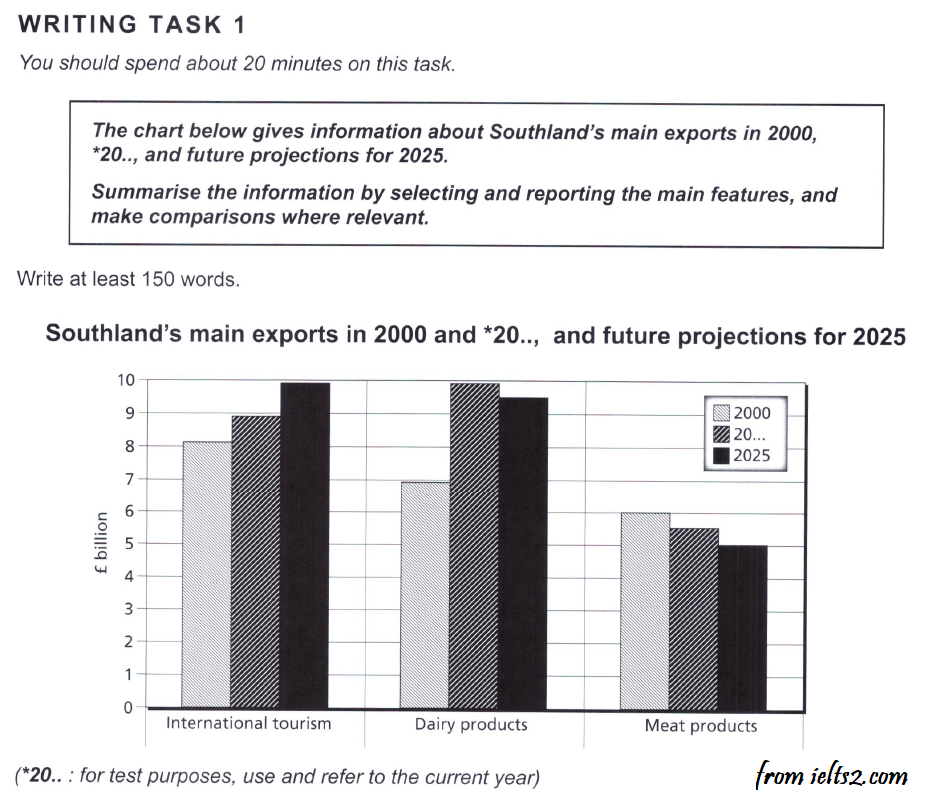
The bar chart illustrates three important exports from Southland over two past decades and a projection of 2025.
Overall, it appears that over the years, those exports with initial higher value (International Tourism and Dairy products) showed considerable improvement while the one with the lowest level at the beginning (Meat products) had a falling trend.
International tourism was the biggest export earner at the initial value of about 8 billion Pounds (BP) in 2000. By 2000s, its value had improved to just under 9 BP, before the estimation of increasing another billion in 2025, and becoming the biggest earner of all times through all categories along with dairy products in 2000s.
Dairy product, however are expected to fall slightly from their peak of 9 BP in 2000s to 8 MP in 2025. It is interesting to note that unlike international tourism, its initial value of export was a lower figure at only 7 BP.
Meat products, showed a moderate revenue of 6 BP in 2000, and had a falling trend over the next decade with expectation of the same pattern. to a low of only 4 BP in 2025, which makes it the lowest earner of all times and all categories.
Total = 203 words
.
سمپل رایتینگ نقشه آیلتس Task 1 نمره 8 تا 9 (نمودار میله ای آیلتس)
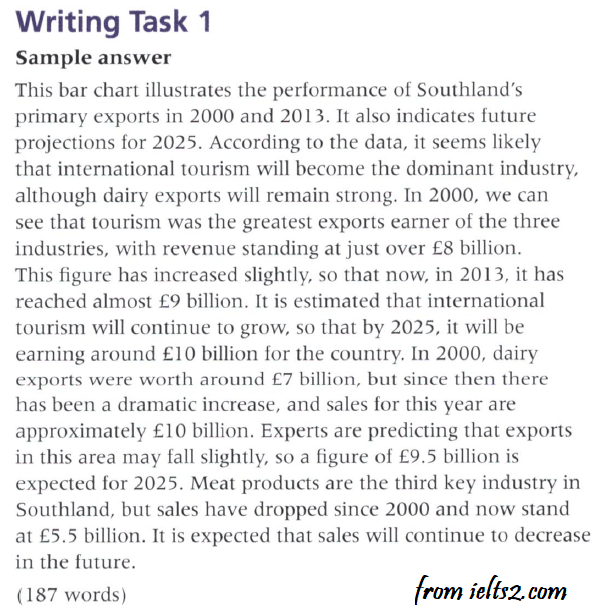
نمونه پاسخ نوشته شده توسط زبان آموزان دوره مهرماه 1399 برای نمودار میله ای آیلتس بالا
The bar chart provides information on three principal exports from Southland in 2000 and 2020 and projections for 2025. (19 words)
International tourism is the greatest export earner of the three industries over the whole period. Its initial value was 8 billion pounds in 2000 and by 2020, it had reached one more billion. It is predicted that this industry will continue to grow and earn almost £10 billion in 2025. (50 words)
Dairy products experience a considerable growth. Although they rose from £7 billion in 2000, this industry increased remarkably to £10 billion in 2020. Yet, there will be a slight fall for exports in this area and a figure of £9 billion is expected for 2025. (45 words)
Meat products are the lowest earner of the three categories during the period. They started from £6 billion in 2000 whereas currently stand at £5.5 billion in 2020. It is expected meat products revenue will continue to decrease and lose half billion pounds in 2025. (45 words)
Overall, it seems that although international tourism remains as the dominant industry in Southland’s export market and also the export of dairy products increases significantly, exporting meat products decreases continuously. (30 words)
Total Words: 189
.
.
نمونه پاسخ نوشته شده توسط زبان آموزان دوره آذرماه 1399 برای نمودار میله ای آیلتس بالا
The bar chart demonstrates three groups of Southland’s principal exports in 3 different periods, 2000, 20…, and future forecasts for 2025.
Based on the information reported, international tourism, with 9 billion Pounds (BP), had the highest exports among all three categories in 2000. This amount reached just under 9 billion in 20… and is expected to peak at around 10 billion by 2025.
Dairy exports initially had only 7 BP exports, but grew sharply in 20… and this amount was equal to the number of international tourism exports in the same year (approximately 10 BP). According to the data, dairy exports will decline slightly in 2025 and reaching 9 and a half BP.
In 2000, exports of meat products with 6 BP had the lowest amount among all groups. According to the data in this chart, this group had a slight decrease and is estimated to reach its minimum amount of 5 PB in 2025.
Overall, International tourism and dairy exports have grown significantly in this country and will be the largest exported products in the future, but on the other hand, exports of meat products will be steadily declining. (190 words)
.
#feedback
1️⃣❌will decline slightly in 2025 and reaching 9 and a half BP. ✅will decline slightly in 2025, reaching 9 and a half BP.
یا هر دو زمان آینده یا به این صورت بنویسید.
2️⃣❌exports of meat products will be steadily declining. ✅the revenue generated from the exports of meat products will be steadily declining.
✅ رایتینگ بسیار خوبی هست. کوشش کنید تمرکز بیشتری بر روی ساختارهای سمپل های نمره 9 در گزینش و گزارش اطلاعات داخل ویژوال ها داشته باشید.
مطالبی برای مطالعه بیشتر
کلمات آیلتس موضوع اقتصاد (Economy)
نمودار میله ای رایتینگ آیلتس – Bar Chart
کمبریج 13 نمودار میله ای تست 3 (Bar Chart)
نمودار میله ای کمبریج 17 آکادمیک تست 3 (پاسخ نمره 8)
آموزش بیشتر درباره نمودارهای میله ای آیلتس
تعیین سطح رایگان رایتینگ شما
یک نمونه نمودار میله ای آیلتس را همراه با چندین پاسخ برای آن را هم دیدیم. برای تصحیح رایگان رایتینگ در کانال تلگرامی رایتینگ ما همراه باشید.


A glance at the bar chart provided reveales some information about three main exports from Southland over two past decades and a projection of 2025.
In 2000, Southland’s earning from international tourism, diary products and meat products was 8,7 and 6 billion pounds(bp) respectively. The same order is peedicted to happen in 2025. From maximum to minimum, international tourism with 10 bp. Next, diary products which will be just over 9 bp and the last, meat production with 5 bp.
At the present time, diary products exports earn the highest amount which is around 10bp. After that it is international tourism with 9 bp and the last one is meat products with just under 6 bp.
Overall, it can be seen that while international tourism exports had higher initial amount and is expected to remain the maximum in the future, meat products with the lowest initial value is predicted to decrease.