نمونه رایتینگ آیلتس آکادمیک درباره How Frequently People in USA Fast Food Restaurant
در این صفحه یک نمونه رایتینگ بار چارت تسک 1 آکادمیک از کمبریج آیلتس 12 آکادمیک تست 3 (Cambridge IELTS 12 Academic Test 3) توسط مدرس آیلتس (مهندس ابوالقاسمی) با نمره 8 رایتینگ نوشته شده که برای زبان آموزان گرامی به صورت رایگان در دسترس می باشد. این نمونه از نظر ساختارهای گرامری و واژگان بدون خطا می باشد و سطح آن حدود 7 تا 7.5 براورد میشود.
نمونه رایتینگ بار چارت How Frequently People in USA Ate in Fast Food Restaurant
پاسخ مدرس در سطح نمره 7.5 به سوال رایتینگ بار چارت فست فود
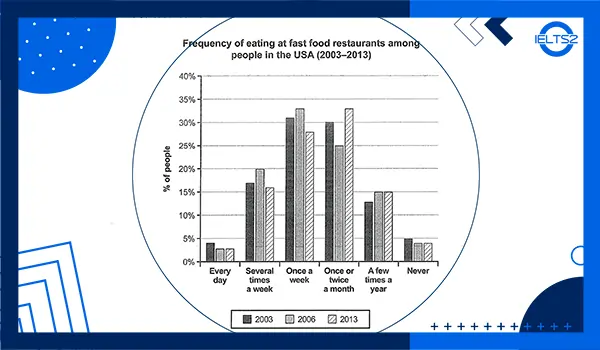
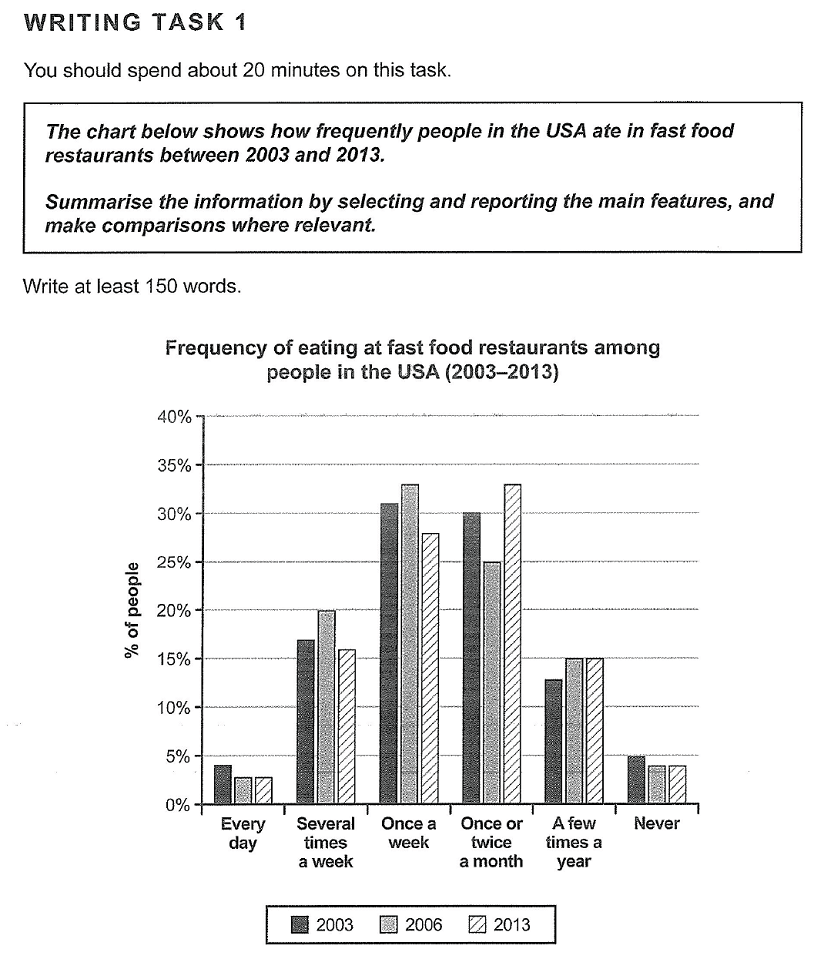
The chart illustrates six categories based on the frequency of fast food consumption in USA in three different years over a decade between 2003 and 2013.
It is most common for American people to consume fast food once a week or once or twice a month since about 30 percent of the population is reported to have these habits in 2003. In 2013, however, this number decreased by about 5 percent for the former and increased by a similar amount for the latter.
In 2003, those who had fast food several times a week and few time annually constituted slightly over and under 15 percent of the population respectively. A decade later in 2013, the first group seems to had increased by a few percent before falling closer to 15 percent and the second group, despite showing a few percent of increase, finally stabilized at its starting level. Only a negligible percentage (almost 5 percent) of Americans ate either everyday or never and both showed a downward trend to form an even smaller percentage.
Overall, eating every week and every month seems to be the most popular eating habits for fast foods during this period and it appears in all categories there is a tendency to remain unchanged.
(Total 208 words)
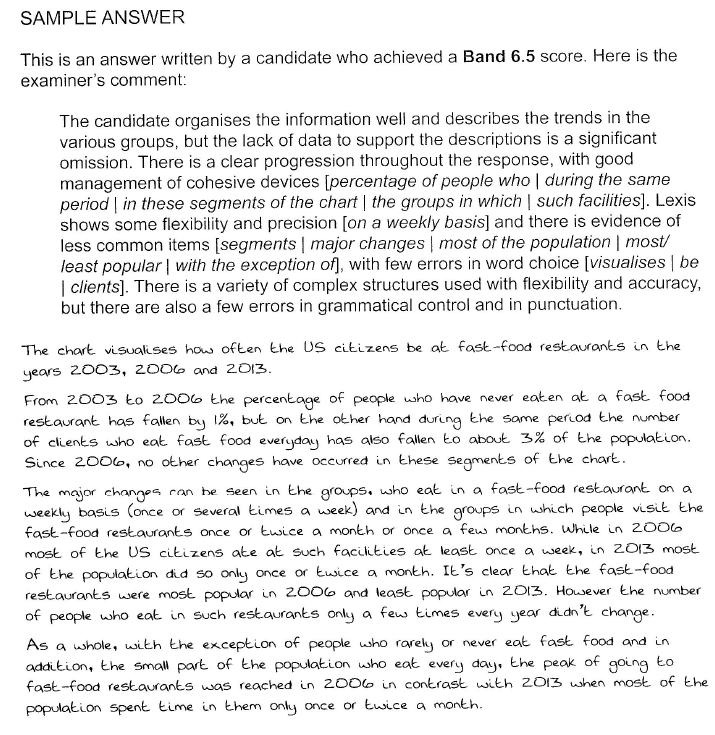
نمونه رایتینگ نمره 6.5 بار چارت How Frequently People in USA Ate in Fast Food Restaurant
نکات مهم درباره رایتینگ های بار چارت تسک 2 رایتینگ آیلتس آکادمیک
در رایتینگ تسک ۱ آیلتس (نمودارهای میلهای)، رعایت اصول زیر به شما کمک میکند نمره بالایی کسب کنید:
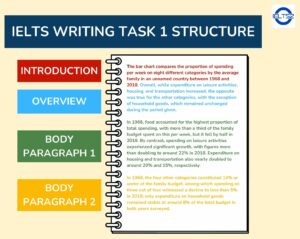
۱. ساختار کلی (Structure) بار چارت ها
مقدمه (Introduction):
جمله اول را با پارافریز کردن سؤال (تغییر کلمات با حفظ معنا) شروع کنید.
مثال:سؤال: “The bar chart shows the percentage of people who used the internet in four countries in 2000, 2005 and 2010.”
پارافریز: “The bar chart illustrates the proportion of internet users in four different countries over three years (2000, 2005, and 2010).”
کلیات (Overview):
در یک یا دو جمله روندهای کلی (بالاترین/پایینترین مقادیر، تغییرات عمده) را بیان کنید.
مثال:
“Overall, the usage of the internet increased in all countries, with Country A having the highest percentage throughout the period.”بدنه اصلی (Body Paragraphs):
دادهها را دستهبندی کنید (مثلاً براساس سالها یا کشورها).
مقایسه بین گروههای مختلف انجام دهید.
از اعداد و درصدها دقیق استفاده کنید (مثلاً “rose from 20% to 50%”).
۲. زبان و گرامر (Language & Grammar) در بار چارت ها
افعال توصیفی مناسب:
برای افزایش: increase, rise, grow, climb
برای کاهش: decrease, decline, drop, fall
برای ثبات: remain stable, stay unchanged
برای نوسان: fluctuate, vary
واژگان مقایسهای:
higher/lower than, the highest/the lowest, compared to, in contrast
زمانهای صحیح:
اگر نمودار مربوط به گذشته است، از گذره ساده استفاده کنید.
اگر روند تا حال/آینده ادامه دارد، از حال کامل یا حال ساده استفاده کنید.
۳. نکات کلیدی در بار چارت ها
از کپیکردن سؤال خودداری کنید (پارافریز کنید).
دادههای جزئی را بیش از حد گزارش ندهید (بهجای آن، روندها را تحلیل کنید).
از جملات پیچیده و متنوع استفاده کنید (نمره Coherence & Grammatical Range افزایش مییابد).
حداقل ۱۵۰ کلمه بنویسید (ترجیحاً ۱۶۰-۱۸۰).
۴. مثال کاربردی
نمودار: درصد استفاده از اینترنت در سه کشور (۲۰۰۰-۲۰۱۰).
پاراگراف نمونه (Body):
“In 2000, Country A had the highest internet usage at 40%, while Country B and C stood at 20% and 10%, respectively. By 2010, the figures for all three countries rose significantly, with Country A reaching 80%, surpassing the others. However, the most dramatic growth was seen in Country C, where the percentage quadrupled over the decade.”
مطالبی برای مطالعه بیشتر
Many people nowadays change career more frequently than ever
Fast food IELTS Writing task 2
چارت ترکیبی کمبریج 19 آکادمیک تست چهارم
نمونه رایتینگ pie chart و جدول آیلتس
سخن آخر
نمونه رایتینگ آیلتس آکادمیک بار چارت درباره How Frequently People in USA Fast Food Restaurant را با هم دیدیم و درباره نمودارهای میله ای رایتینگ آیلتس صحبت کردیم. برای تصحیح رایگان رایتینگ آیلتس در کانال تلگرام ما همراه باشید.